NAS100 Analysis – April 13
The NAS100 index is currently demonstrating a clear bearish trajectory as it trades below key resistance levels. Technical analysis reveals that the 9-day Simple Moving Average (SMA), which is sloping downward, now acts as a dynamic barrier near the $18,300 level. Continued trading below this SMA indicates a lack of bullish momentum. Additionally, the Moving Average Convergence Divergence (MACD) indicator confirms this sentiment, with its main line notably trailing the signal line. Collectively, these technical signals imply sustained short-term selling pressure.
NAS100 Key Levels
Resistance Levels: $19120, $20650, $22140
Support Levels: $18320, $17250, $16500
NAS100 Long-Term Trend: Bearish
A notable shift in market dynamics has occurred following the price’s failure to break above the $22,140 resistance level, resulting in the formation of lower highs and lower lows. A bearish order block within the $20,550–$20,650 range significantly hindered upward movement, prompting a sharp return to the downward trend. The ongoing formation of lower highs is further validated by a descending trendline, with current price action struggling to breach the $19,120 resistance level, which aligns with the SMA—effectively suppressing bullish attempts.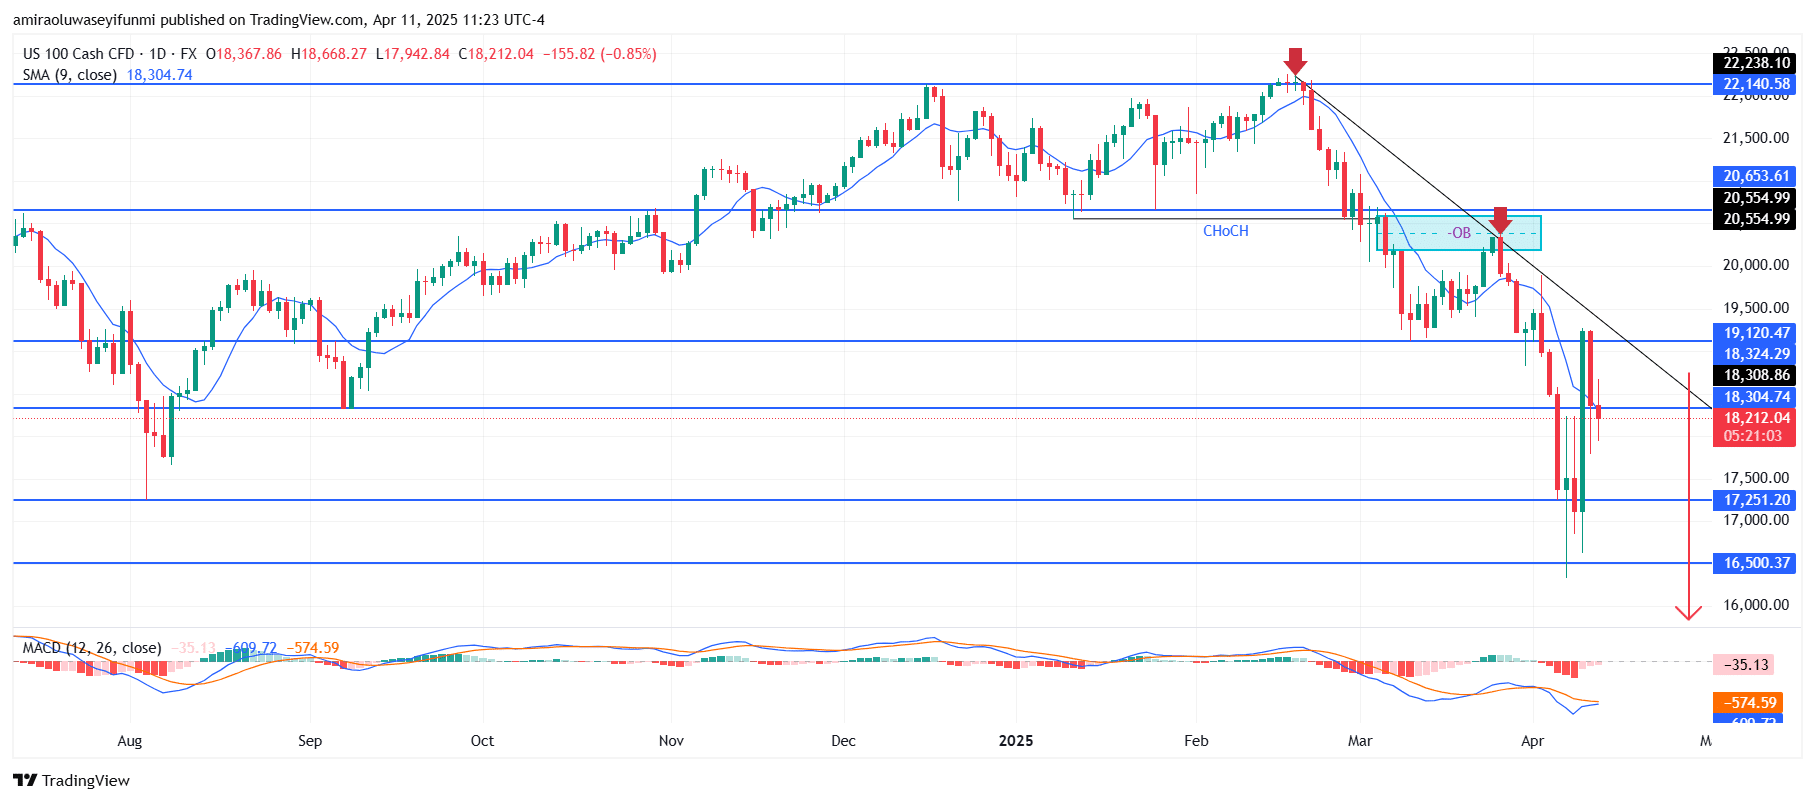
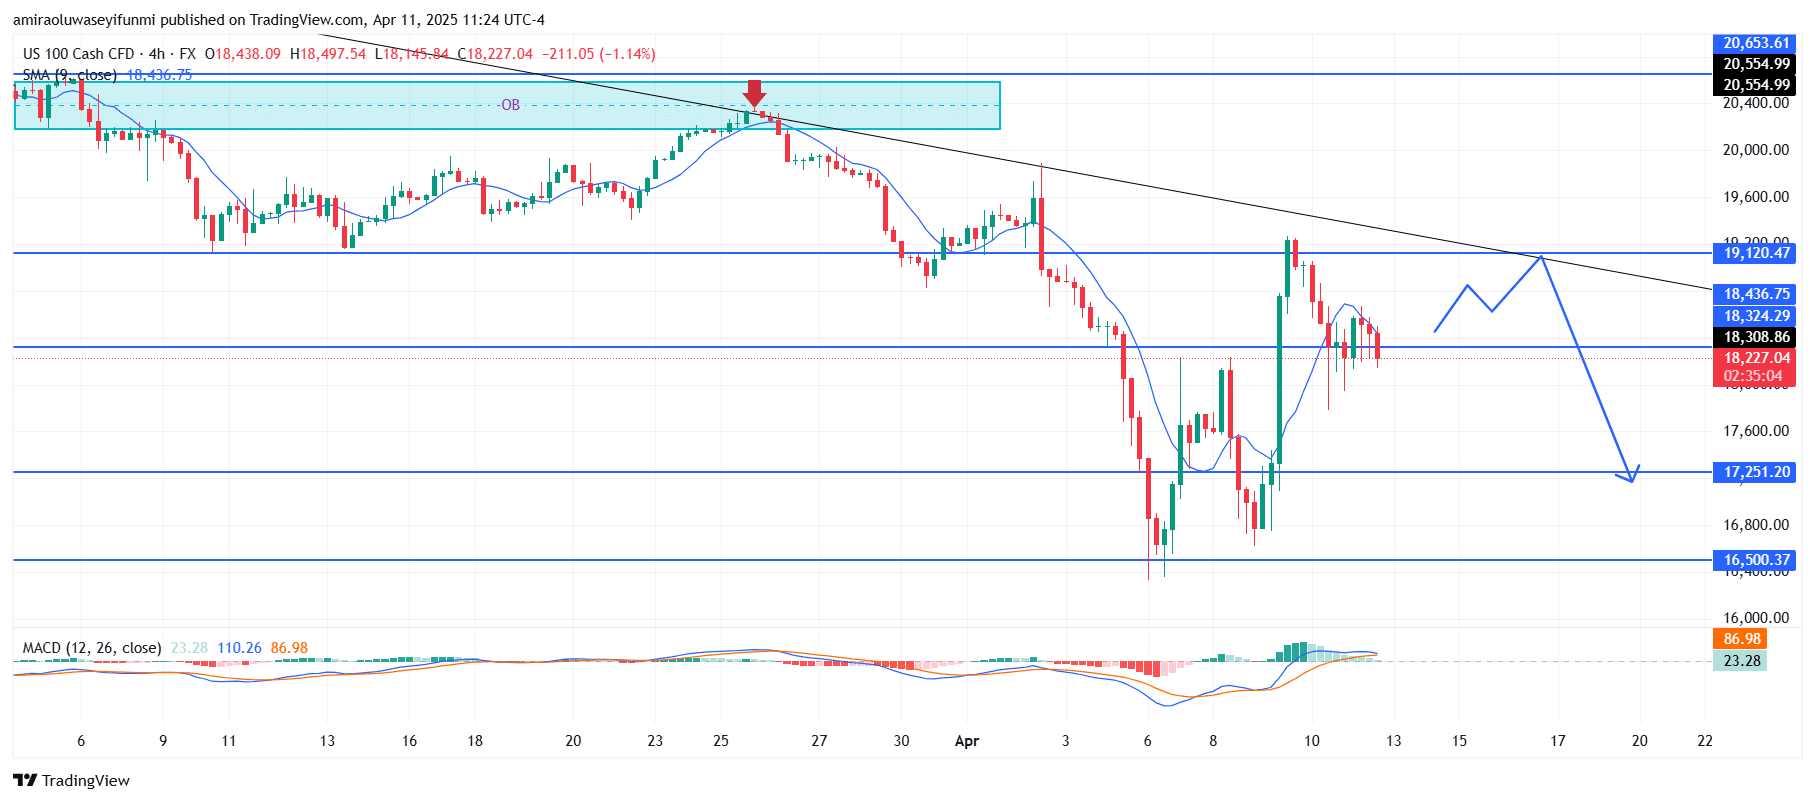
NAS100 Short-Term Trend: Bearish
In the short term, NAS100 maintains its bearish posture, consistently forming lower highs beneath the descending trendline. The index remains below the 9 SMA, and recent rejections at the trendline further affirm the ongoing downtrend. Although the MACD histogram shows a slight decrease in bearish intensity, suggesting waning bullish momentum, the overall technical setup indicates that the price is likely to move toward the $17,250 support level.
Make money without lifting your fingers: Start using a world-class auto trading solution
How To Buy Lucky Block – Guide, Tips & Insights | Learn 2 Trade
Note: Learn2.trade is not a financial advisor. Do your research before investing your funds in any financial asset, product, or event. We are not responsible for your investment results.
- Broker
- Min Deposit
- Score
- Visit Broker

- Award-winning Cryptocurrency trading platform
- $100 minimum deposit,
- FCA & Cysec regulated

- 20% welcome bonus of upto $10,000
- Minimum deposit $100
- Verify your account before the bonus is credited
- Fund Moneta Markets account with a minimum of $250
- Opt in using the form to claim your 50% deposit bonus
Learn to Trade
Never Miss A Trade Again

Signal Notification
Real-time signal notifications whenever a signal is opened, closes or Updated

Get Alerts
Immediate alerts to your email and mobile phone.

Entry Price Levels
Entry price level for every signal Just choose one of our Top Brokers in the list above to get all this free.