NAS100 Analysis – April 6
NAS100 extends its decline as bearish pressure intensifies. The index continues to slide as selling momentum gains traction. Technical indicators, especially the MACD (Moving Average Convergence Divergence), highlight the strength of the ongoing downtrend. The MACD line remains well below the signal line, while the growing negative histogram bars indicate a deepening bearish move. Current MACD readings, with the MACD line around -427 and the signal line near -149, confirm a strong downward phase. At the same time, the 9-day Simple Moving Average (SMA) is steadily declining and sits around $19,210—well above current price levels. This gap illustrates the market’s bearish bias and underscores the dominance of sellers.
NAS100 Key Levels
Resistance Levels: $19,120, $20,650, $22,140
Support Levels: $18,320, $17,250, $16,500
NAS100 Long-Term Trend: Bearish
The market experienced a clear change of character (CHoCH) around the $20,550 level, followed by a rejection from a bearish order block near the same zone. The price dropped sharply below this level and continued through the $18,320 support, establishing another bearish order block at the previous high of $19,120. The latest bearish candlestick confirms heightened selling pressure. Another major support can be found around $17,250.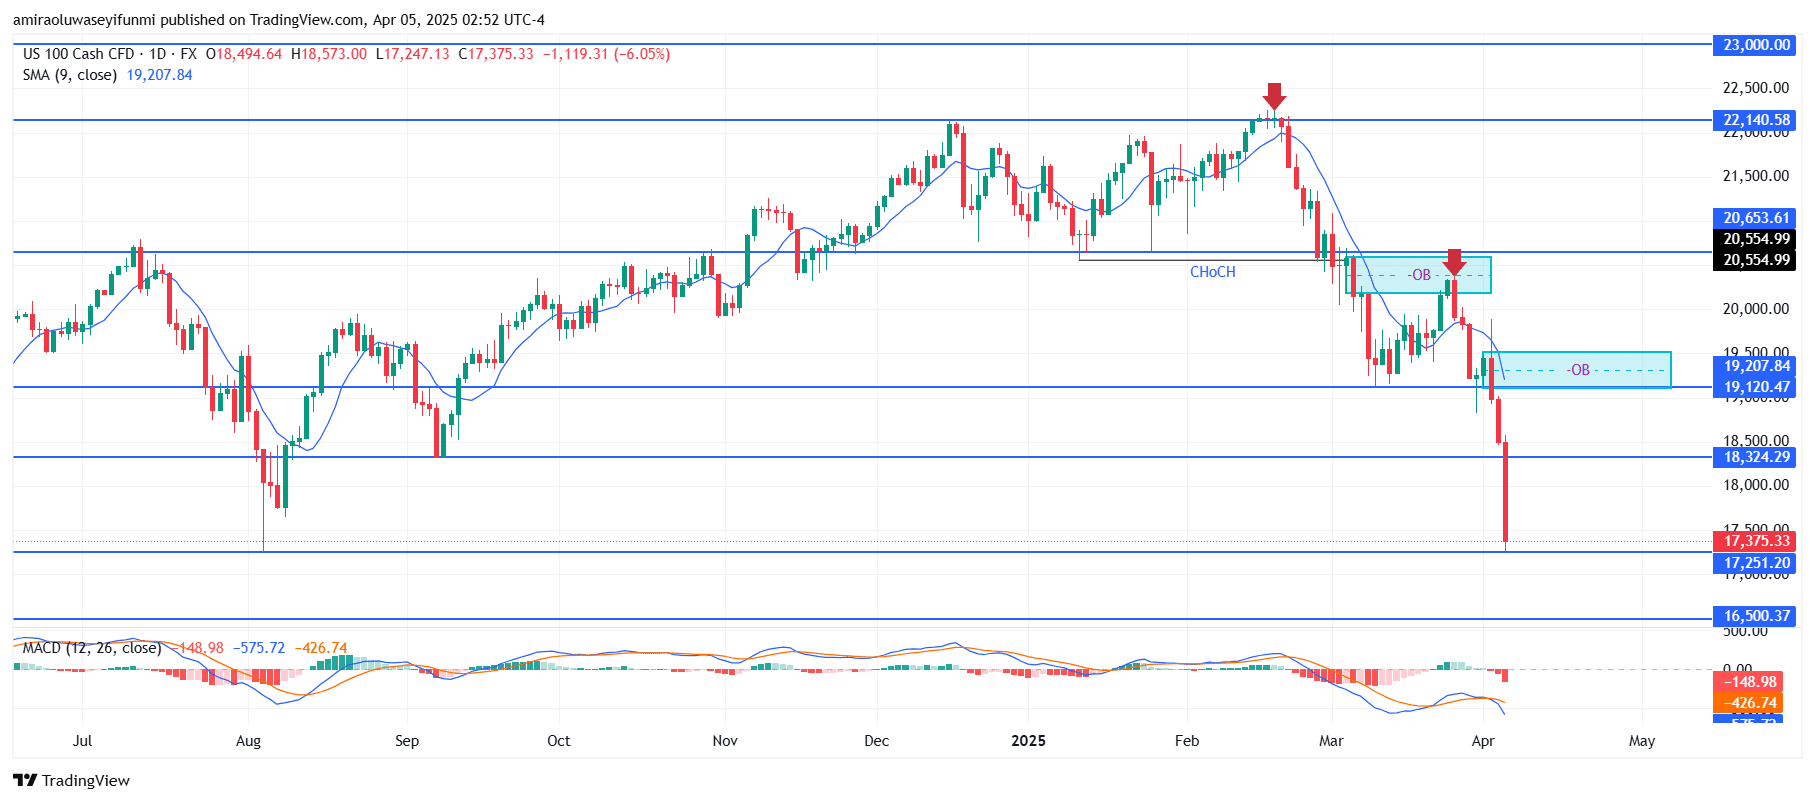
NAS100 Short-Term Trend: Bearish
NAS100 maintains a bearish structure on the 4-hour chart, forming consistent lower highs and lower lows. A sharp rejection from a bearish order block near the $20,550 level triggered renewed downward momentum.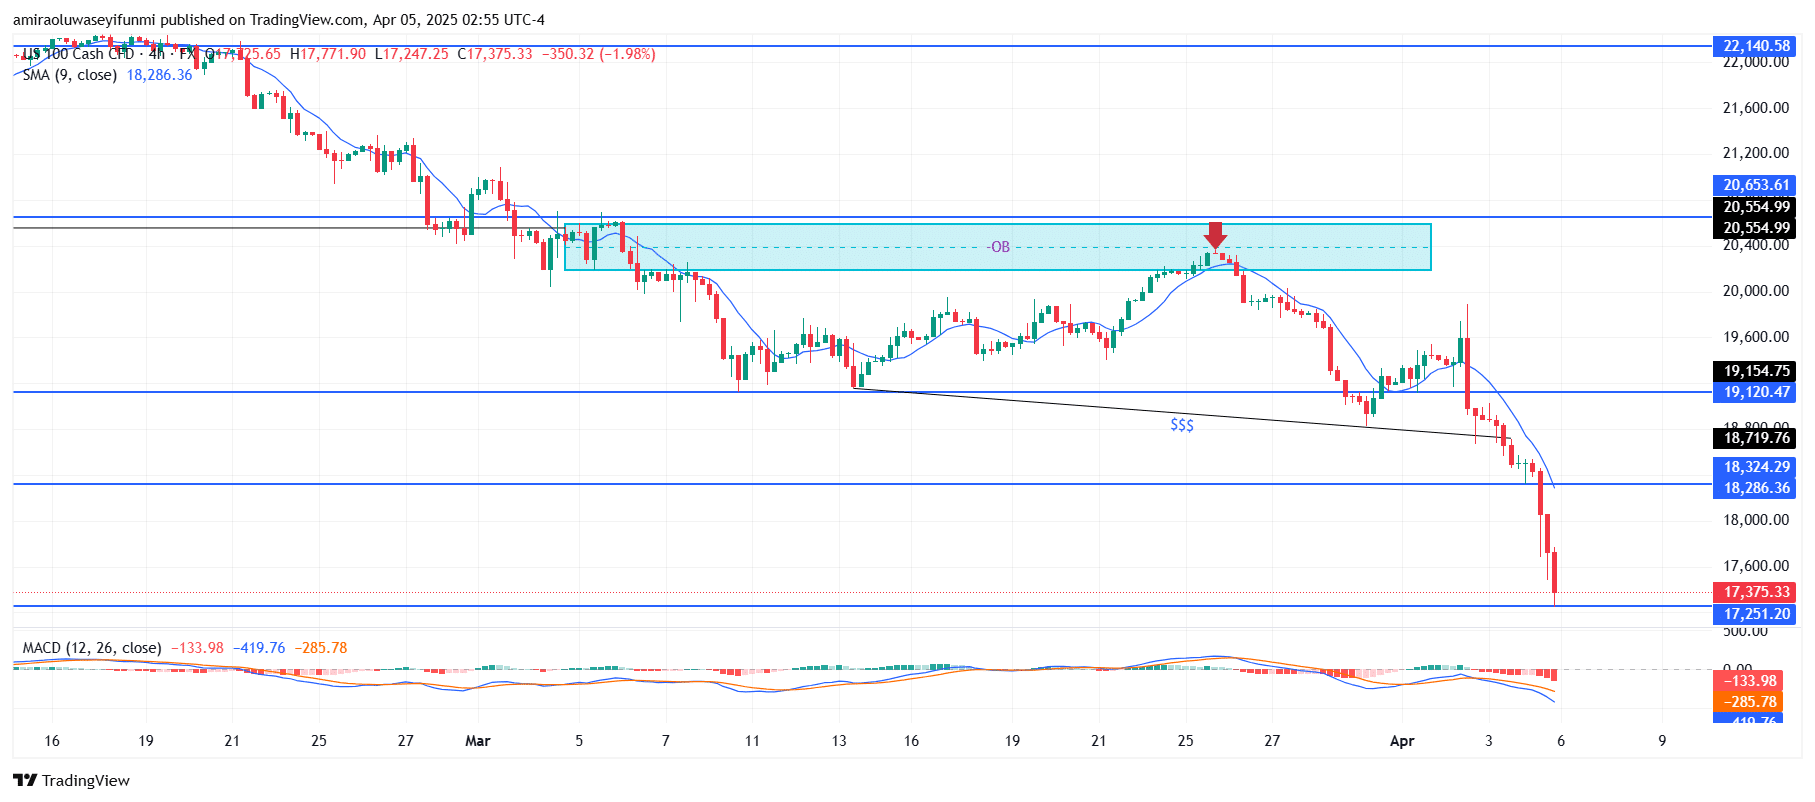
Make money without lifting your fingers: Start using a world-class auto trading solution
How To Buy Lucky Block – Guide, Tips & Insights | Learn 2 Trade
Note: Learn2.trade is not a financial advisor. Do your research before investing your funds in any financial asset, product, or event. We are not responsible for your investment results.
- Broker
- Min Deposit
- Score
- Visit Broker

- Award-winning Cryptocurrency trading platform
- $100 minimum deposit,
- FCA & Cysec regulated

- 20% welcome bonus of upto $10,000
- Minimum deposit $100
- Verify your account before the bonus is credited
- Fund Moneta Markets account with a minimum of $250
- Opt in using the form to claim your 50% deposit bonus
Learn to Trade
Never Miss A Trade Again

Signal Notification
Real-time signal notifications whenever a signal is opened, closes or Updated

Get Alerts
Immediate alerts to your email and mobile phone.

Entry Price Levels
Entry price level for every signal Just choose one of our Top Brokers in the list above to get all this free.