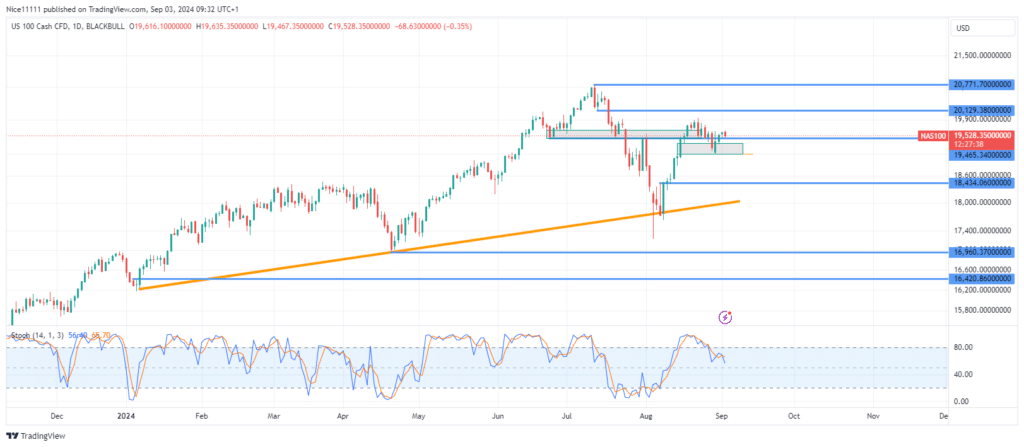
The Nasdaq 100 recently transitioned into a bullish trend, gaining momentum after surpassing the previous swing high at 19,900. This upward move faced resistance, leading to a pullback that tested the Hanging Man candle for support. The price is now attempting to recover, indicating a continuation of the bullish trend, though with slightly reduced momentum. This retracement reflects the market’s cautious approach, but the overall bullish sentiment remains strong.
The prior bearish trend halted as it reached the bullish trendline, which acts as crucial support on the daily chart. The anchored swing lows from January and April are vital reference points for future price projections, indicating a strong foundation for the current uptrend.
The price surge above the last bearish order block during the downtrend marks a significant shift towards a bullish market. Following a bullish break of structure (BOS), the price retraced to retest a Hanging Man candle formed on August 14th, which also includes a fair value gap. After this pullback, the price has risen from the fair value gap, reinforcing the bullish outlook. Forex signals could help traders identify entry points during this bullish phase.
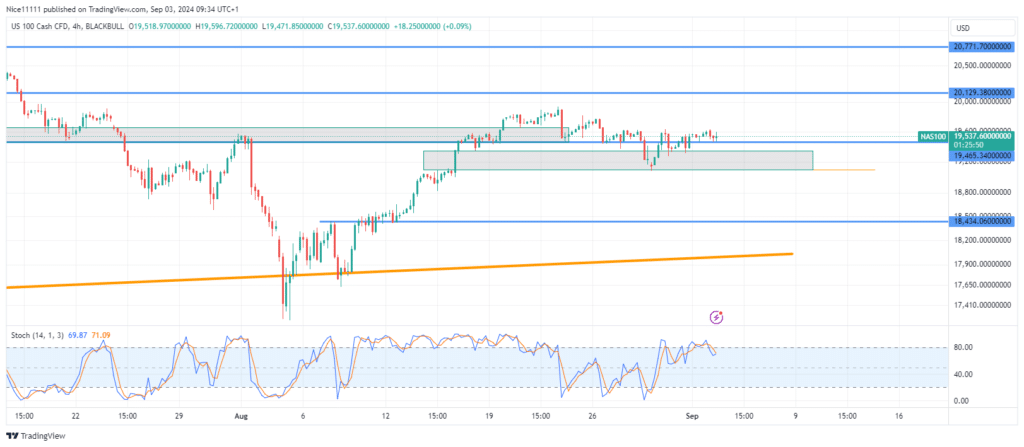
Nasdaq 100 Short-Term Trend: Ranging
In the short term, momentum seems to be fading as the price moves sideways on the 4-hour chart. The next target is the supply zone at 20,129.0, where resistance is expected. A successful breach of this level could reignite stronger bullish momentum, pushing the Nasdaq 100 higher in the upcoming sessions. Forex signals might be instrumental in navigating this potential breakout.
Note: Learn2.trade is not a financial advisor. Do your research before investing your funds in any financial asset, product, or event. We are not responsible for your investment results.
Trade on MT4 with Leverage up to 1:500! Trade on MT4 with Leverage up to 1:500!
X
We use cookies to ensure that we give you the best experience on our website. If you continue to use this site we will assume that you are happy with it.