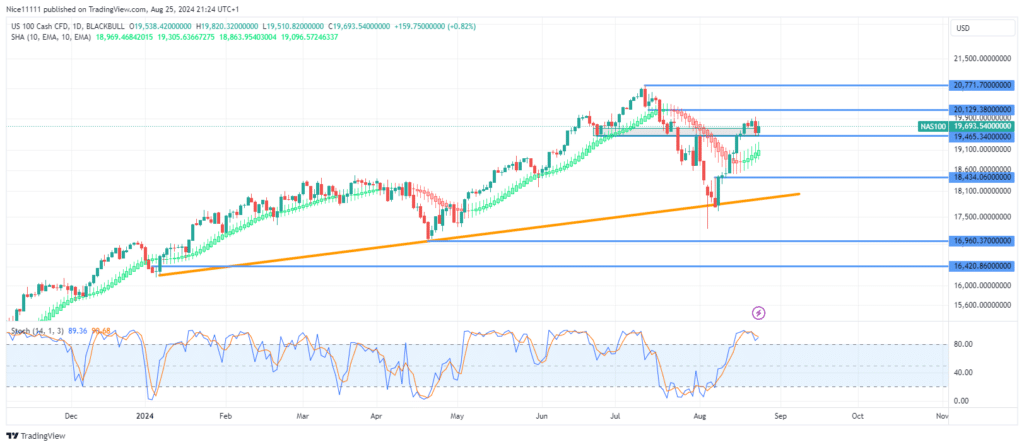
The Nasdaq 100 index tested its bullish trendline on the daily chart this August, leading to a significant bullish reversal. The recent price rally has successfully broken the key resistance level at 19,465.0.
The bullish trendline test coincided with a Stochastic signal indicating an oversold market, triggering a rapid price recovery. A long wick formed at the test, suggesting a strong price rebound.
The Nasdaq 100 price has since surged above the last bearish order block at 19,465.0, marking the previous swing high of the bearish trend. This breach is a key indication of a potential bullish market shift. Furthermore, the Smoothed Heikin Ashi candles have turned green, with custom daily candles showing dominance—further confirming the uptrend.
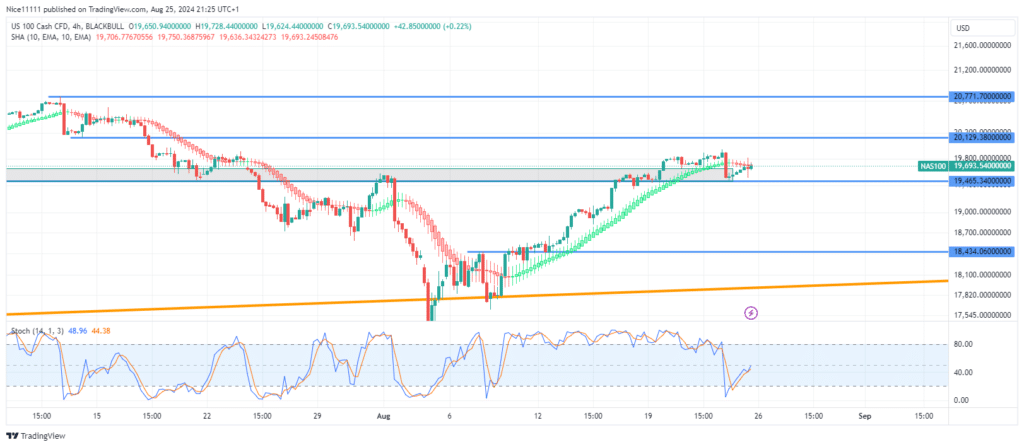
Nasdaq 100 Short-Term Trend: Bullish
In the short term, the price has pulled back to the critical 19,465.0 zone, a level that has acted as both support and resistance in the recent past. This pullback appears to be testing for support before potentially continuing its ascent toward breaking the next resistance at 20,129.0.
For traders looking for reliable forex signals, monitoring how the price interacts with the 19,465.0 level will be crucial in determining the strength of this bullish momentum.
Note: Learn2.trade is not a financial advisor. Do your research before investing your funds in any financial asset, product, or event. We are not responsible for your investment results.
Trade on MT4 with Leverage up to 1:500! Trade on MT4 with Leverage up to 1:500!
X
We use cookies to ensure that we give you the best experience on our website. If you continue to use this site we will assume that you are happy with it.