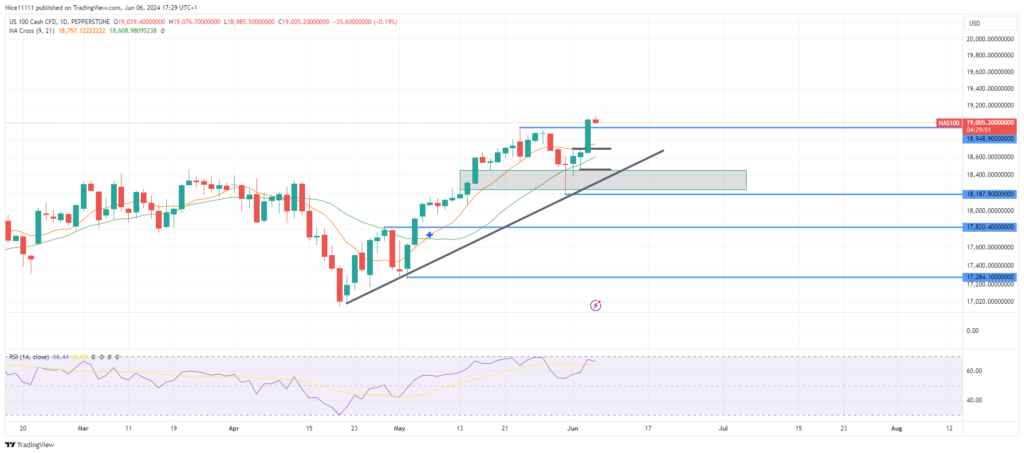
Nasdaq 100 index experienced a dip after reaching 18,948.00. The price pulled back to the inefficiently traded region denoted by the fair value gap on the daily chart. The appearance of a dragonfly doji candle signalled a rapid recovery in price after filling this gap.
Nasdaq 100 Key Levels
Demand Levels: 18,187.0, 17,820.0
Supply Levels: 18,948.0, 20,000.0
Nasdaq 100 Long Term Trend: Bullish
The bullish trend for US100 resumed in April following a significant, albeit temporary, pullback. The Relative Strength Index (RSI) reached the oversold region just as the price began to ascend. A failed low is observed on the daily chart, establishing a bullish reversal. These lows have been utilized to anchor a bullish trend line, aiding future price pullback prognostication.
The price’s rise to the 18,948.0 resistance level featured fair value gaps on the bullish swing. Upon reaching this resistance, the RSI indicated an overbought market, prompting a retracement to correct market inefficiencies. The emergence of a dragonfly doji highlighted the market’s readiness to recover and continue its upward trajectory.
Nasdaq 100 Short Term Trend: Bullish
In the short term, the price has surpassed the previous swing high preceding the retracement. The Moving Averages (Periods 9 and 21) currently support the price ascent on both the daily and 4-hour charts, reinforcing the continuation of the bullish trend towards 20000.0
You can purchase Lucky Block – Guide, Tips & Insights | Learn 2 Trade here. Buy LBLOCK
Note: Learn2.trade is not a financial advisor. Do your research before investing your funds in any financial asset or presented product or event. We are not responsible for your investing results.
Trade on MT4 with Leverage up to 1:500! Trade on MT4 with Leverage up to 1:500!
X
We use cookies to ensure that we give you the best experience on our website. If you continue to use this site we will assume that you are happy with it.

 Nasdaq 100 Short Term Trend: Bullish
 Nasdaq 100 Short Term Trend: Bullish


