Key Resistance Zones: 15000, 15500, 16000
Key Support Zones: 13500, 13000, 12500
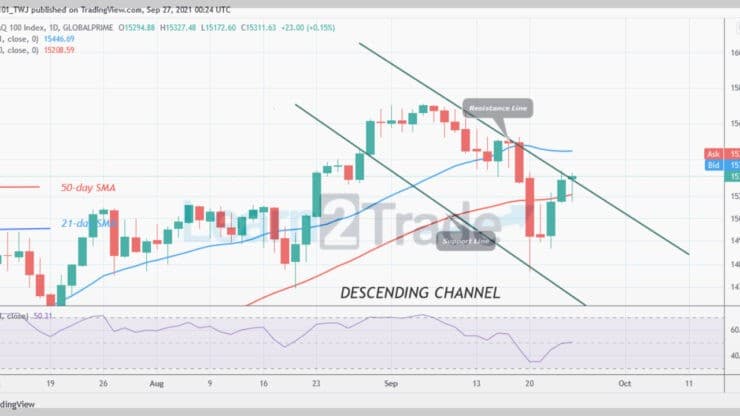
NASDAQ 100 (NAS100) Long-term Trend: Bullish
NAS100 index has resumed an upward move after it fell to the low of level 14800. The bullish momentum has broken above the 50-day SMA. The index is rising and approaching the 21-day SMA. A break above the 21-day SMA will propel the index to rise on the upside. Presently, NAS100 has risen to level 15311 at the time of writing.
Daily Chart Indicators Reading:
NAS100 is at level 50 of the Relative Strength period 14. It indicates that there is a balance between supply and demand. The index price is breaking the resistance line of the descending channel. If the candlesticks close above the resistance line, the uptrend will continue on the upside. The 50-day SMA and the 21-day SMA are sloping upward indicating the uptrend.
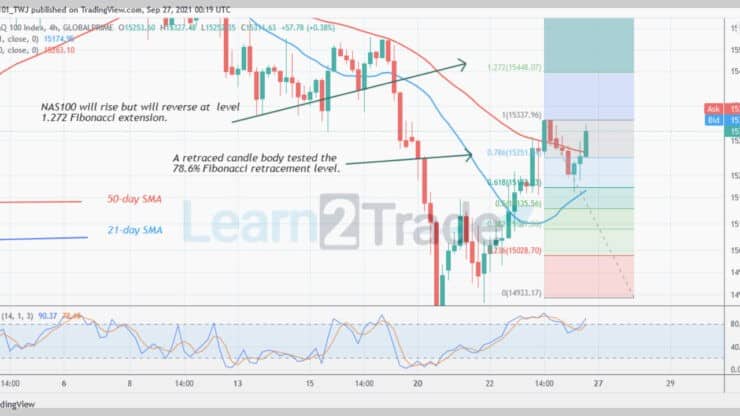
NASDAQ 100 (NAS100) Medium-term Trend: Bullish
On the 4- hour chart, NAS100 is in an uptrend. In the first uptrend, the index reached the high of level 15330 but was repelled. The market declined to level 15200 and resumed an uptrend. NAS100 is rising to retest the recent high. Meanwhile, on September 23 uptrend, a retraced candle body tested the 78.6% Fibonacci retracement level. The retracement indicates that NAS100 is likely to rise to level 1.272 Fibonacci extensions or level 15448.27 .
4-hour Chart Indicators Reading
The index is above the 80% range of the daily stochastic. It indicates the market has reached the overbought region. Also, the selling pressure is reaching bearish exhaustion. The 21-day SMA and the 50-day SMA are sloping upward indicating the uptrend.
General Outlook for NASDAQ 100 (NAS100)
NAS100 has recovered from the downtrend as price breaks above the 50-day SMA. Buyers have pushed the index to the high of level 15311. On September 6, buyers pushed the index to the high of level 15711 but were repelled.
You can purchase crypto coins here: Buy Token
Note: Learn2.Trade is not a financial advisor. Do your research before investing your funds in any financial asset or presented product or event. We are not responsible for your investing results
- Broker
- Min Deposit
- Score
- Visit Broker

- Award-winning Cryptocurrency trading platform
- $100 minimum deposit,
- FCA & Cysec regulated

- 20% welcome bonus of upto $10,000
- Minimum deposit $100
- Verify your account before the bonus is credited
- Fund Moneta Markets account with a minimum of $250
- Opt in using the form to claim your 50% deposit bonus
Learn to Trade
Never Miss A Trade Again

Signal Notification
Real-time signal notifications whenever a signal is opened, closes or Updated

Get Alerts
Immediate alerts to your email and mobile phone.

Entry Price Levels
Entry price level for every signal Just choose one of our Top Brokers in the list above to get all this free.