Key Resistance Zones: 16000, 16500, 17000
Key Support Zones: 13500, 13000, 12500
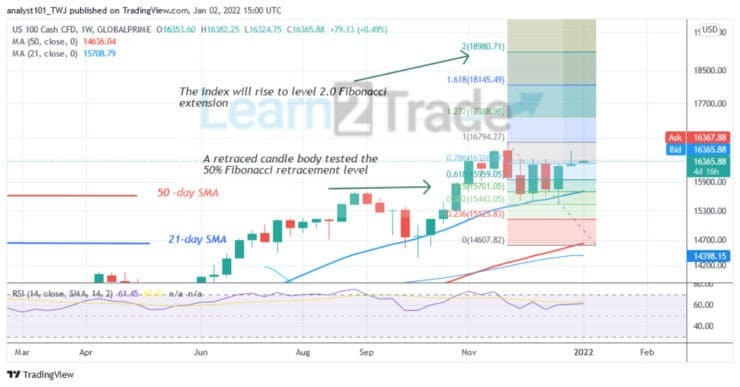
NASDAQ 100 (NAS100) Long-term Trend: Ranging
NAS100 index trades in a sideways trend and resumes selling pressure. The uptrend on November 15 was interrupted as the index resumed a downward move. NASDAQ 100 dropped from the high of level 16627 to a low of level 15504. Since then the uptrend has been restricted below level 16400. The index now fluctuates between levels 15300 and 16400. The index will rise to level 18500 if the current overhead resistance is breached.
Daily Chart Indicators Reading:
NAS100 is at level 61 of the Relative Strength for period 14. It indicates that NAS100 is in the bullish trend zone and capable of rising on the upside. The index price is above the 50-day line SMA and the 21-day line SMA which indicate that the market will further rise. The 50-day SMA and the 21-day SMA are sloping upward indicating the uptrend.
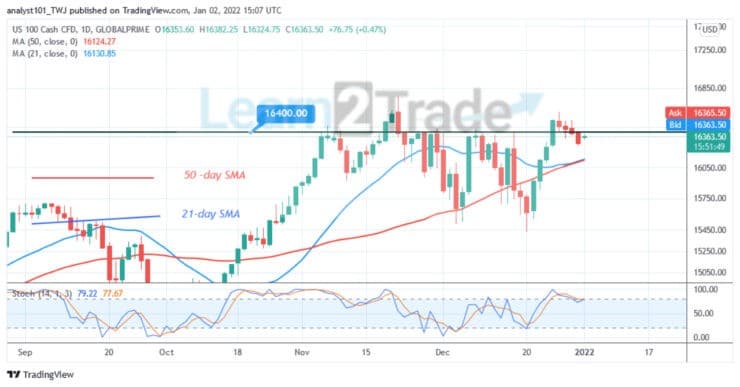
NASDAQ 100 (NAS100) Medium-term Trend: Ranging
On the daily chart, NAS100 is in a sideways move. The upward move has been hampered by the overhead resistance at level 16400. On three occasions the bulls broke above the resistance level but were repelled. On December 27, buyers failed to keep the price above the overhead resistance. Today, NASDAQ 100 is falling below the overhead resistance.
Daily Chart Indicators Reading
The index has fallen below the 80% range of the daily stochastic. It indicates that the market has reached the overbought region. Sellers will emerge to push prices down. The 21-day SMA and the 50-day SMA are sloping horizontally indicating the sideways trend.
General Outlook for NASDAQ 100 (NAS100)
NAS100 reaches an overbought region of the market and resumes selling pressure. The current decline may reach the low of level 15450 If price breaks below the moving averages.
You can purchase crypto coins here: Buy Tokens
Note: Learn2.Trade is not a financial advisor. Do your research before investing your funds in any financial asset or presented product or event. We are not responsible for your investing results
- Broker
- Min Deposit
- Score
- Visit Broker

- Award-winning Cryptocurrency trading platform
- $100 minimum deposit,
- FCA & Cysec regulated

- 20% welcome bonus of upto $10,000
- Minimum deposit $100
- Verify your account before the bonus is credited
- Fund Moneta Markets account with a minimum of $250
- Opt in using the form to claim your 50% deposit bonus
Learn to Trade
Never Miss A Trade Again

Signal Notification
Real-time signal notifications whenever a signal is opened, closes or Updated

Get Alerts
Immediate alerts to your email and mobile phone.

Entry Price Levels
Entry price level for every signal Just choose one of our Top Brokers in the list above to get all this free.