Don’t invest unless you’re prepared to lose all the money you invest. This is a high-risk investment and you are unlikely to be protected if something goes wrong. Take 2 minutes to learn more
Market Analysis – August 28th
Nasdaq 100 bears take a breather, allowing buyers an opportunity to re-enter the market. While the market continues to favor the bears, sellers are putting up a fight against the prevailing trend.
The selling pressure intensified after a bullish swing that reached the key level of 15914.00. However, since sellers have been unable to breach the key level of 14534.00, buyers are now attempting to regain control.
Nasdaq 100 Market Zones
Resistance Zones: 15194.00, 14534.00
Support Zones: 13552.00, 12570.00
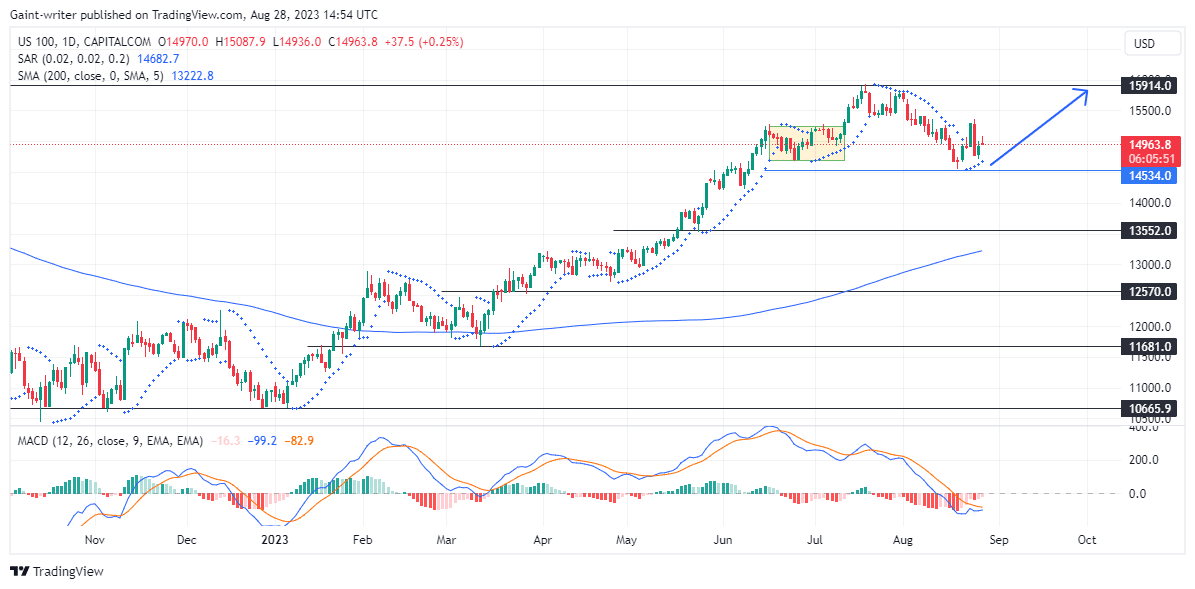
Nasdaq 100 Long-Term Trend: Bullish
The bullish sentiment in the market has been evident as the bulls raised the bar this year. This upward momentum can be observed on the daily chart. This is due to the Parabolic SAR (Stop and Reverse) indicator picking up impulses from the buyers.
The MACD (Moving Average Convergence and Divergence) indicator shows signs of synchronizing with bullish sentiment. It suggests that buyers are looking for a way back into the market. Furthermore, the market’s position above the 200 SMA (Simple Moving Average) on the daily chart indicates bullish sentiment.
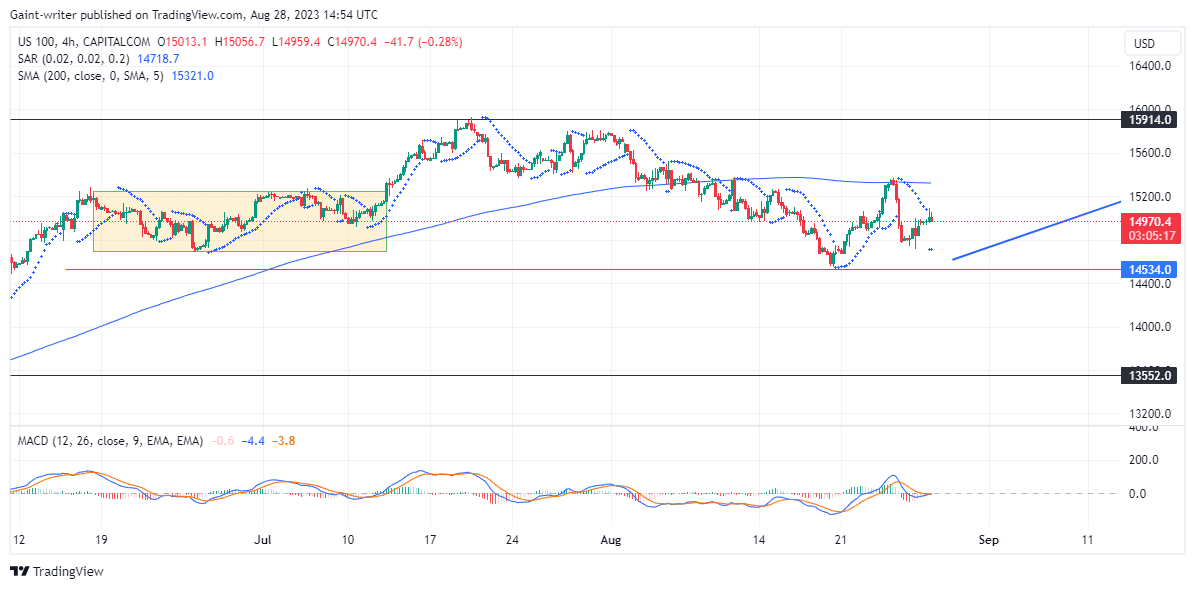
Nasdaq 100 Short-Term Trend: Bullish
As buyers continue to fight back, traders should be prepared for a possible breakout back to the 15914.00 key level. However, on the 4-hour chart, the bulls still lack the momentum needed to make a significant breakthrough. A break above the 200 SMA would confirm the return of buyers’ strength in the market. Traders should therefore look into how prices play out as the week goes by.
You can purchase Lucky Block – Guide, Tips & Insights | Learn 2 Trade here. Buy LBLOCK
Note: Learn2.trade is not a financial advisor. Do your research before investing your funds in any financial asset or presented product or event. We are not responsible for your investing results
- Broker
- Min Deposit
- Score
- Visit Broker

- Award-winning Cryptocurrency trading platform
- $100 minimum deposit,
- FCA & Cysec regulated
9.8

- 20% welcome bonus of upto $10,000
- Minimum deposit $100
- Verify your account before the bonus is credited
9
- Fund Moneta Markets account with a minimum of $250
- Opt in using the form to claim your 50% deposit bonus
9
Learn to Trade
Never Miss A Trade Again

step 1
Signal Notification
Real-time signal notifications whenever a signal is opened, closes or Updated

step 2
Get Alerts
Immediate alerts to your email and mobile phone.

step 3
Entry Price Levels
Entry price level for every signal Just choose one of our Top Brokers in the list above to get all this free.