NAS100 Analysis – October 12
NAS100 sustains its uptrend momentum despite a temporary pullback phase. The index maintains its bullish outlook as price action continues to follow the prevailing upward trend, supported by the short-term moving average around $24,850. The consistent formation of higher highs and higher lows reinforces market optimism, while the MACD continues to indicate underlying buying pressure despite the latest correction. Overall, sentiment remains positive, with the index trading above key dynamic support zones that have historically attracted institutional accumulation.
NAS100 Key Levels
Resistance Levels: $25,000, $26,040, $27,000
Support Levels: $24,050, $23,000, $22,140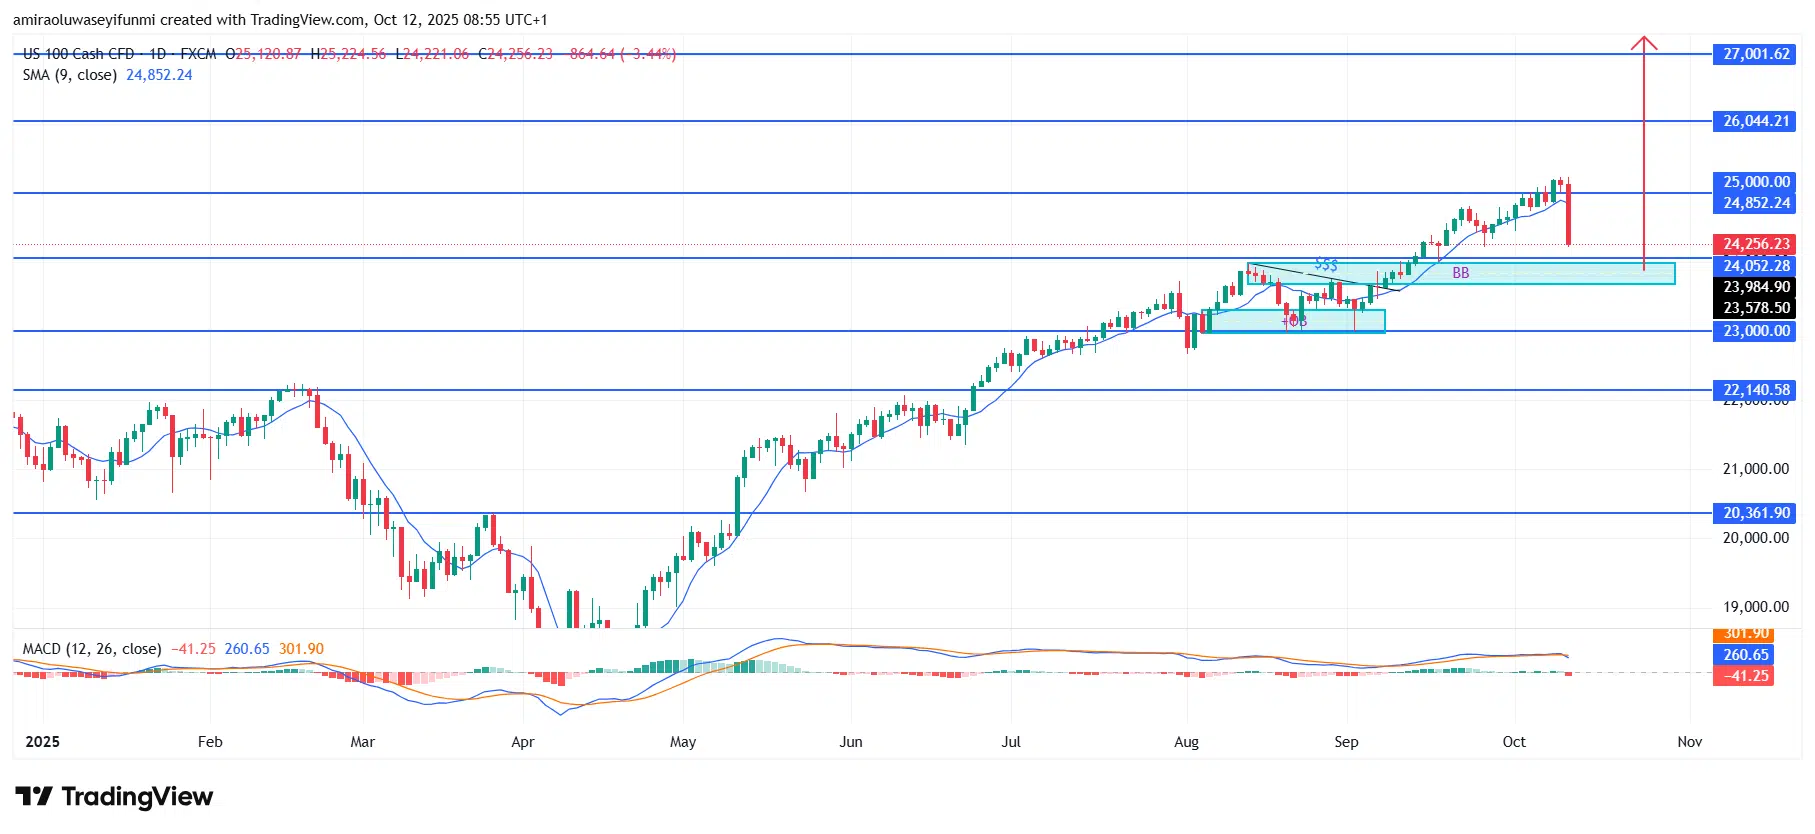
NAS100 Long-Term Trend: Bullish
From a technical perspective, the index experienced a sharp retracement from the recent high near $25,000, briefly testing lower support within the $24,000–$23,600 range. This area aligns with a previously established demand block, suggesting a potential rebound from this price zone. The overall structure remains solid as the market continues to trade above the critical psychological level of $23,000, implying that the current dip could represent a liquidity grab before a renewed upward push.
Looking ahead, NAS100 is likely to regain its bullish momentum once price consolidates above $24,500, targeting an initial resistance near $26,040. A sustained break above this level could pave the way toward the $27,000 region, marking a possible medium-term target. As long as the index maintains its stance above $23,000 and market fundamentals remain supportive, the bullish bias is expected to prevail in the upcoming sessions. Traders monitoring forex signals may find this setup useful for tracking potential continuation opportunities in global equity movements.
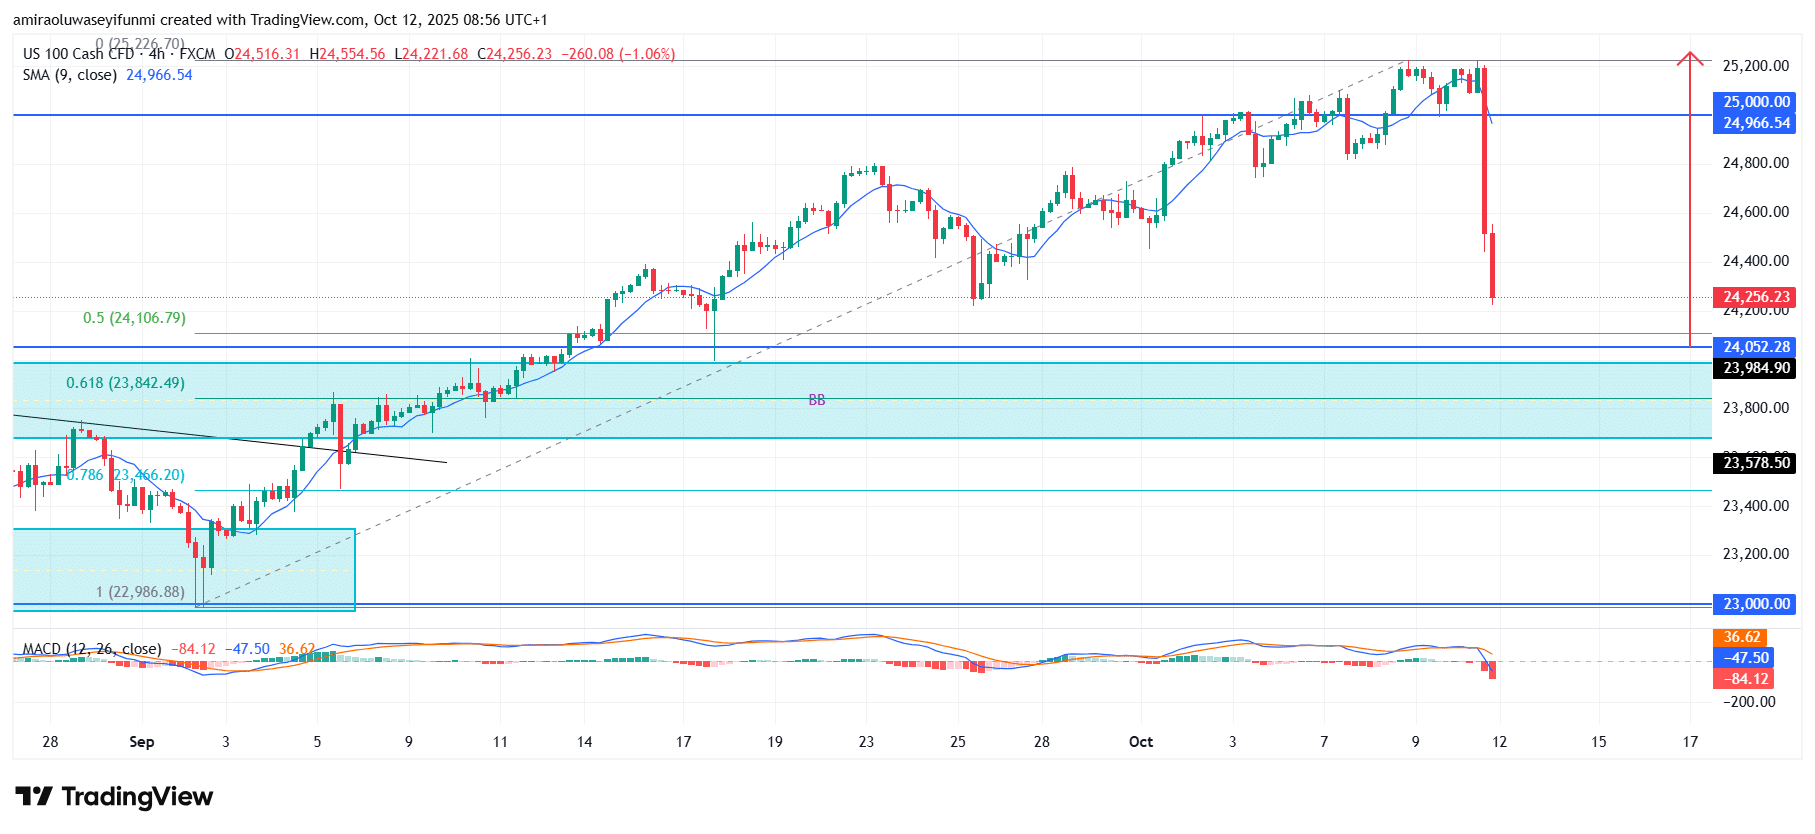
NAS100 Short-Term Trend: Bullish
The NAS100 is currently encountering short-term bearish pressure on the four-hour chart after a strong rejection from the $25,000 resistance level. Price has dipped below the short-term moving average near $24,960, signaling a temporary slowdown in momentum.
However, the zone between $24,100 and $23,800 coincides with the 0.5–0.618 Fibonacci retracement levels, which could serve as a strong demand region. A sustained rebound from this area may reignite bullish momentum toward the $25,200 mark.
Make money without lifting your fingers: Start using a world-class auto trading solution
How To Buy Lucky Block
Note: Learn2.trade is not a financial advisor. Do your research before investing your funds in any financial asset, product, or event. We are not responsible for your investment results.
- Broker
- Min Deposit
- Score
- Visit Broker

- Award-winning Cryptocurrency trading platform
- $100 minimum deposit,
- FCA & Cysec regulated

- 20% welcome bonus of upto $10,000
- Minimum deposit $100
- Verify your account before the bonus is credited
- Fund Moneta Markets account with a minimum of $250
- Opt in using the form to claim your 50% deposit bonus
Learn to Trade
Never Miss A Trade Again

Signal Notification
Real-time signal notifications whenever a signal is opened, closes or Updated

Get Alerts
Immediate alerts to your email and mobile phone.

Entry Price Levels
Entry price level for every signal Just choose one of our Top Brokers in the list above to get all this free.