

NAS100 Analysis – October 19
NAS100 shows renewed momentum toward key resistance levels. Strong market confidence is reflected in the sustained upward momentum as NAS100 consolidates above the 9-day Simple Moving Average (SMA) at $24,790. The Moving Average Convergence Divergence (MACD) indicator displays narrowing histogram bars, signaling a potential bullish crossover as buying pressure builds. Despite occasional profit-taking, the index continues to maintain higher lows, indicating resilient market sentiment and sustained bullish strength.
NAS100 Key Levels
Resistance Levels: $25,000, $26,040, $27,000
Support Levels: $24,050, $23,000, $22,140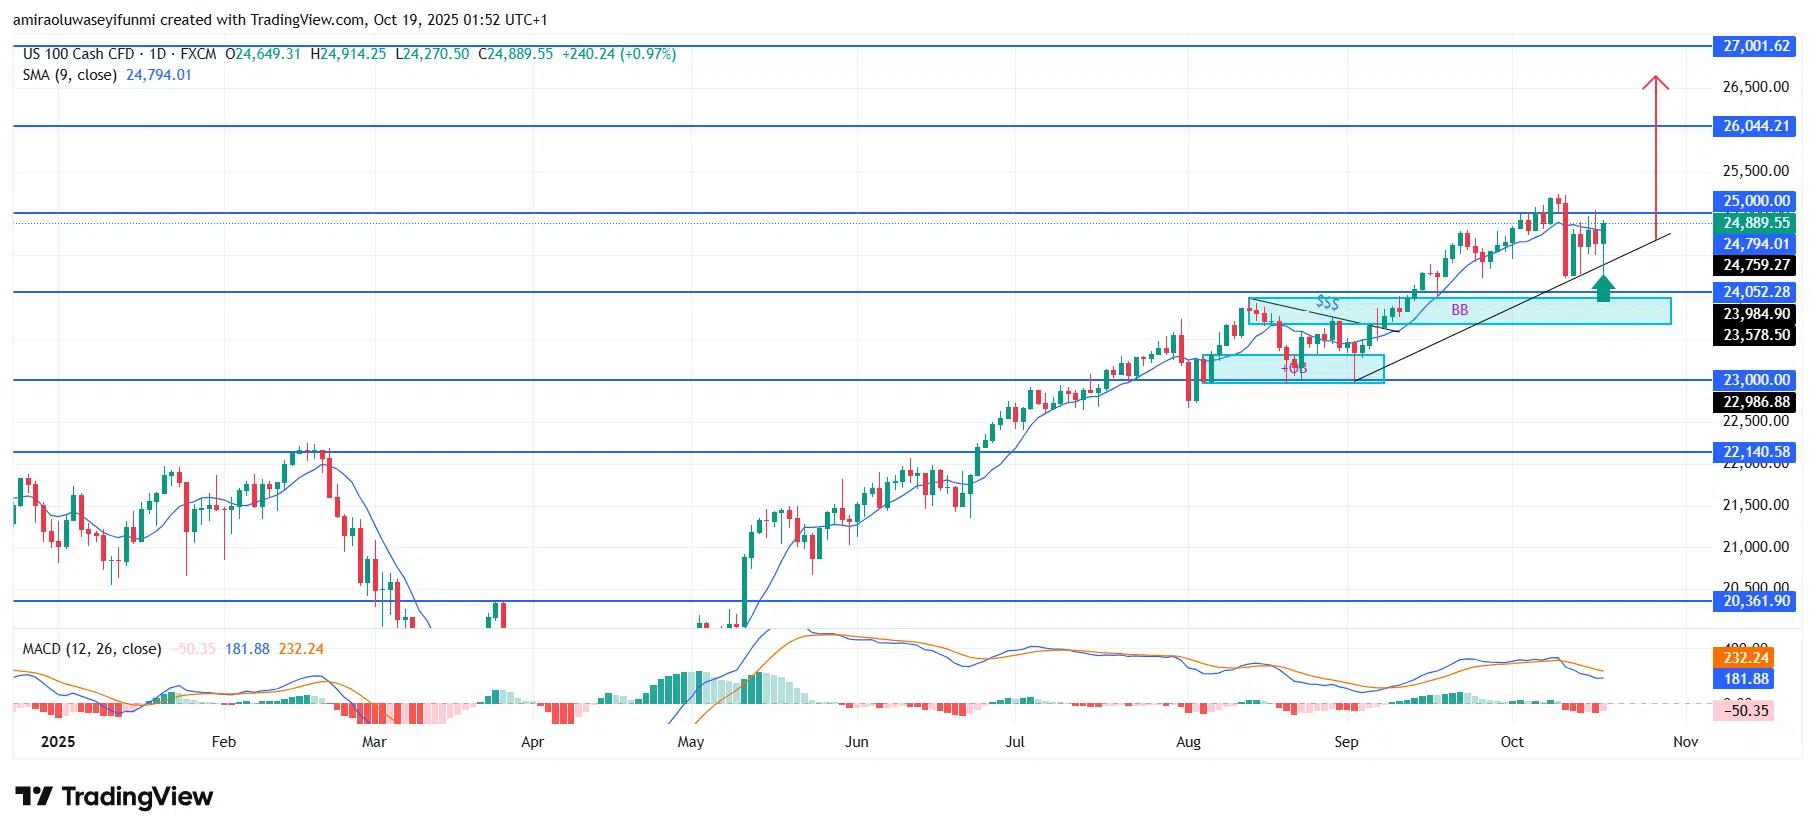
NAS100 Long-Term Trend: Bullish
Price action has successfully reclaimed the $24,050–$23,580 support zone, marking it as a key accumulation region. The ascending trendline remains intact, providing dynamic support and reinforcing the persistent buying interest. The psychological $25,000 mark now stands as a crucial short-term resistance level, while the ongoing recovery aligns with the broader bullish structure that has persisted since May.
NAS100 is expected to break above the $25,000 resistance and advance toward $26,040, with the potential for an extension beyond $27,000 if bullish momentum continues. Sustained trading above the moving average and trendline may strengthen buyer confidence and attract additional institutional participation. Before the next upward phase unfolds, a temporary pullback toward $24,050 could offer renewed buying opportunities for traders monitoring forex signals and other growth-oriented positions.
NAS100 Short-Term Trend: Bearish
Make money without lifting your fingers: Start using a world-class auto trading solution
How To Buy Lucky Block
Note: Learn2.trade is not a financial advisor. Do your research before investing your funds in any financial asset, product, or event. We are not responsible for your investment results.


