NAS100 Analysis – June 1
NAS100 rejects a key zone and signals an imminent bearish reversal. The NAS100 daily chart reveals clear bearish indicators from technical analysis. The price has fallen below the 9-day Simple Moving Average (SMA), currently near $21,250, indicating the early stages of a potential trend reversal. The Relative Strength Index (RSI) is retreating from overbought levels and is now approximately 62.27, highlighting a decline in bullish momentum. Together, these indicators suggest weakening upward pressure and a possible developing downside correction.
NAS100 Key Levels
Resistance Levels: $21,400, $22,140, $23,000
Support Levels: $20,360, $18,320, $17,250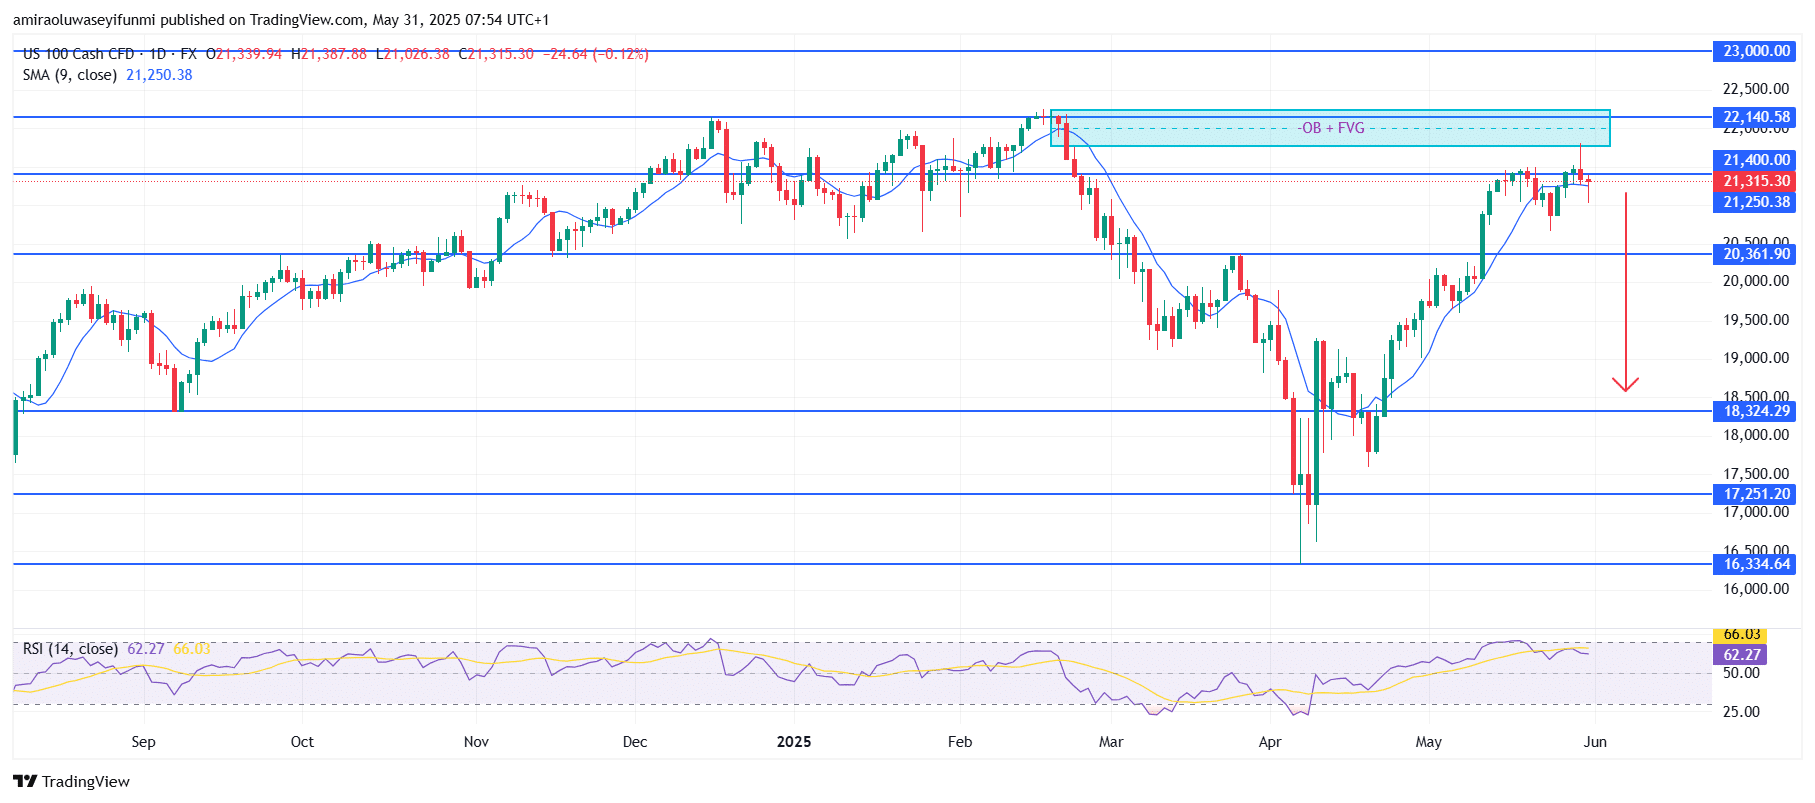
NAS100 Long-Term Trend: Bearish
The index reached a significant supply zone between $21,400 and $22,140, aligning with a previously identified order block and fair value gap (OB + FVG). Price was unable to close above this area, forming rejection wicks and initiating a reversal. The subsequent bearish candles confirm selling pressure. This zone now acts as a strong resistance, having repelled multiple bullish attempts and reinforcing the broader pattern of lower highs since March’s peak.
Looking ahead, bearish momentum is likely to strengthen. A breakdown below the $21,250 SMA support level could lead the price toward the next demand area around $20,360. If downward pressure persists, further targets lie at $18,320 and potentially $17,250. This projection fits with the expected retracement phase, driven by fading bullish momentum and a shift toward lower value regions. Buyers should exercise caution, while sellers may consider current levels for tactical positioning, particularly those relying on forex signals.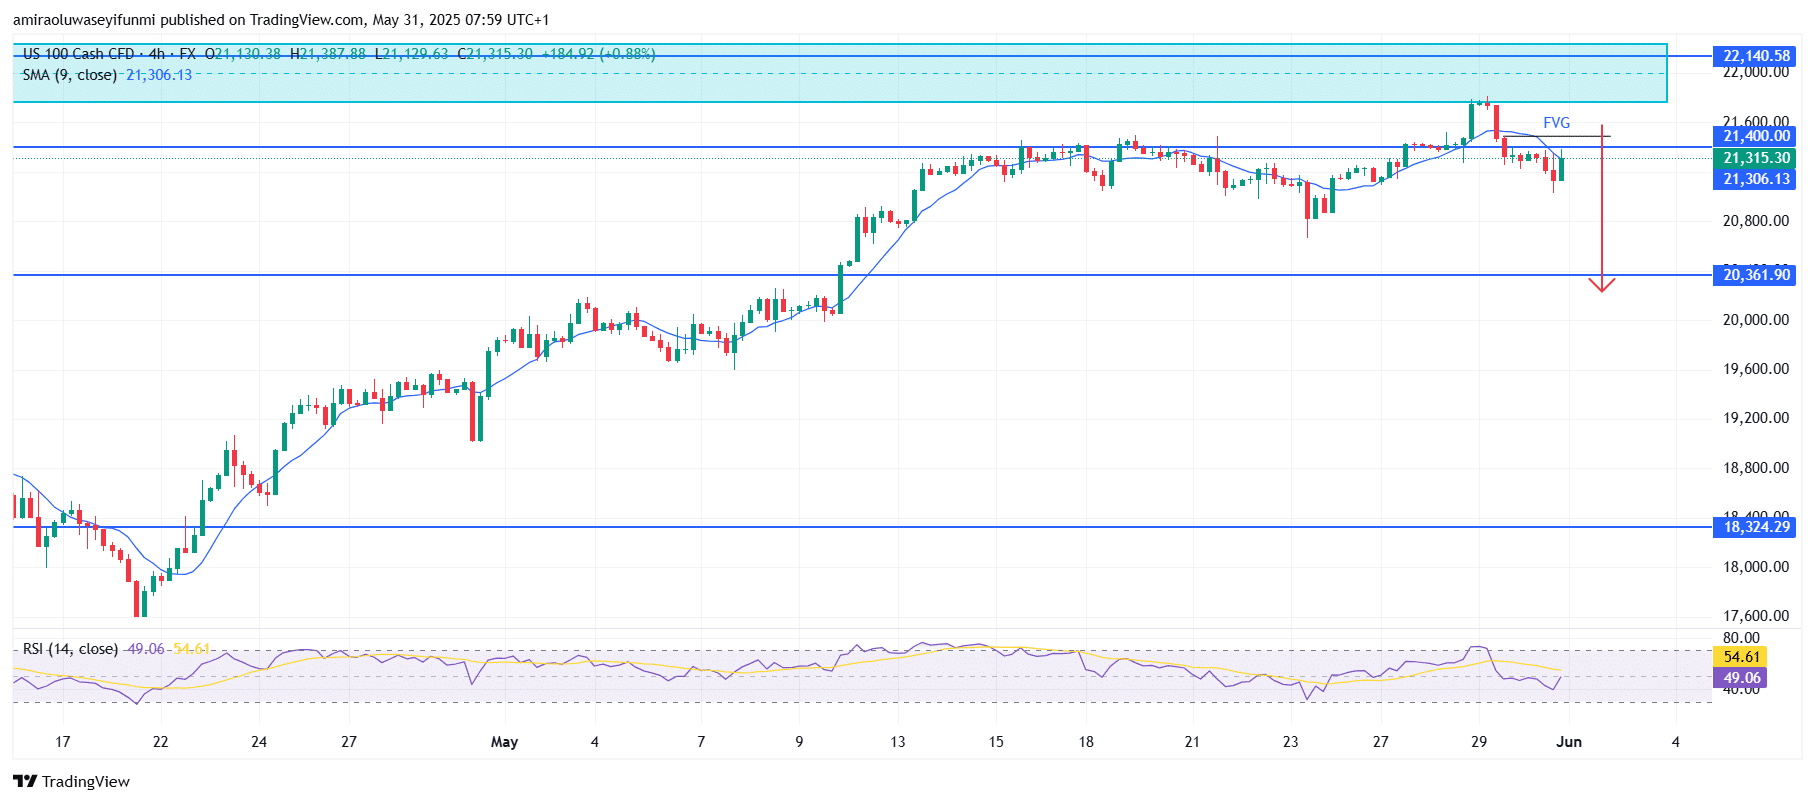
NAS100 Short-Term Trend: Bearish
On the four-hour chart, NAS100 is trading below the 9-period SMA, reinforcing the short-term bearish outlook. Price was rejected from the FVG zone and has not managed to reclaim the $21,400 resistance level.
RSI is trending downward and is currently around 49, reflecting a decline in bullish strength. A decisive break below $21,300 could trigger a move toward the $20,360 demand zone.
Make money without lifting your fingers: Start using a world-class auto trading solution
How To Buy Lucky Block – Guide, Tips & Insights | Learn 2 Trade
Note: Learn2.trade is not a financial advisor. Do your research before investing your funds in any financial asset, product, or event. We are not responsible for your investment results.
- Broker
- Min Deposit
- Score
- Visit Broker

- Award-winning Cryptocurrency trading platform
- $100 minimum deposit,
- FCA & Cysec regulated

- 20% welcome bonus of upto $10,000
- Minimum deposit $100
- Verify your account before the bonus is credited
- Fund Moneta Markets account with a minimum of $250
- Opt in using the form to claim your 50% deposit bonus
Learn to Trade
Never Miss A Trade Again

Signal Notification
Real-time signal notifications whenever a signal is opened, closes or Updated

Get Alerts
Immediate alerts to your email and mobile phone.

Entry Price Levels
Entry price level for every signal Just choose one of our Top Brokers in the list above to get all this free.