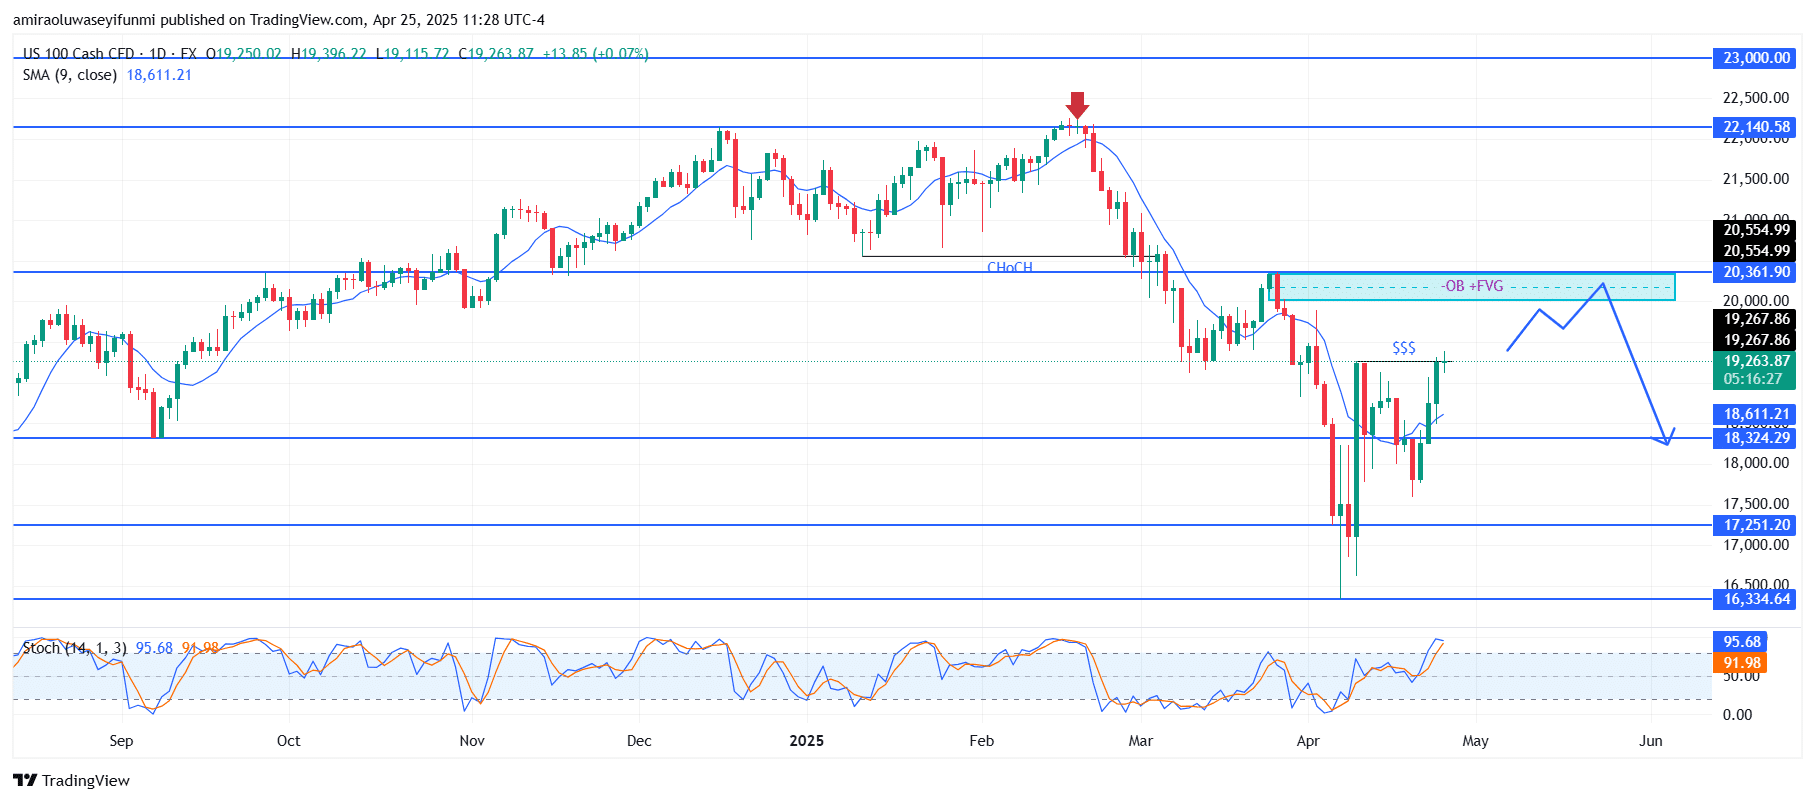
The NAS100 nears a key resistance zone at $20,360 amid persistent bearish outlook. On the daily chart, technical indicators are offering conflicting signals. The 9-period Simple Moving Average (SMA) is sloping downward, affirming continued bearish sentiment. Meanwhile, the Stochastic Oscillator shows readings around 96 and 92, indicating overbought conditions. This suggests that the current upward momentum could soon lose steam, increasing the risk of a market reversal as price approaches significant resistance.
NAS100 Key Levels
Resistance Levels: $20360, $22140, $23000 Support Levels: $18320, $17250, $16330
NAS100 Long-Term Trend: Bearish
Following a strong bearish impulse, the NAS100 is currently pulling back towards a notable supply zone near $20,360. Price action previously signaled a Change of Character (ChoCH) around $19,270, indicating a transition to a bearish trend. The current retracement is targeting an area that includes a Fair Value Gap (FVG) and an Order Block (OB). A sweep of liquidity above $19,270 could drive the index into the $20,360 zone, where significant selling pressure is expected. As long as price remains below this resistance, the long-term bearish bias stays intact.
Moving forward, theexpectation is for the NAS100 to complete this upward retracement and then resume its downward trajectory. If rejection occurs around $20,360, price may begin forming a lower high before a sharp decline. The initial support to watch is at $18,320. Should bearish momentum strengthen, deeper moves towards $17,250 and $16,330 could materialize.
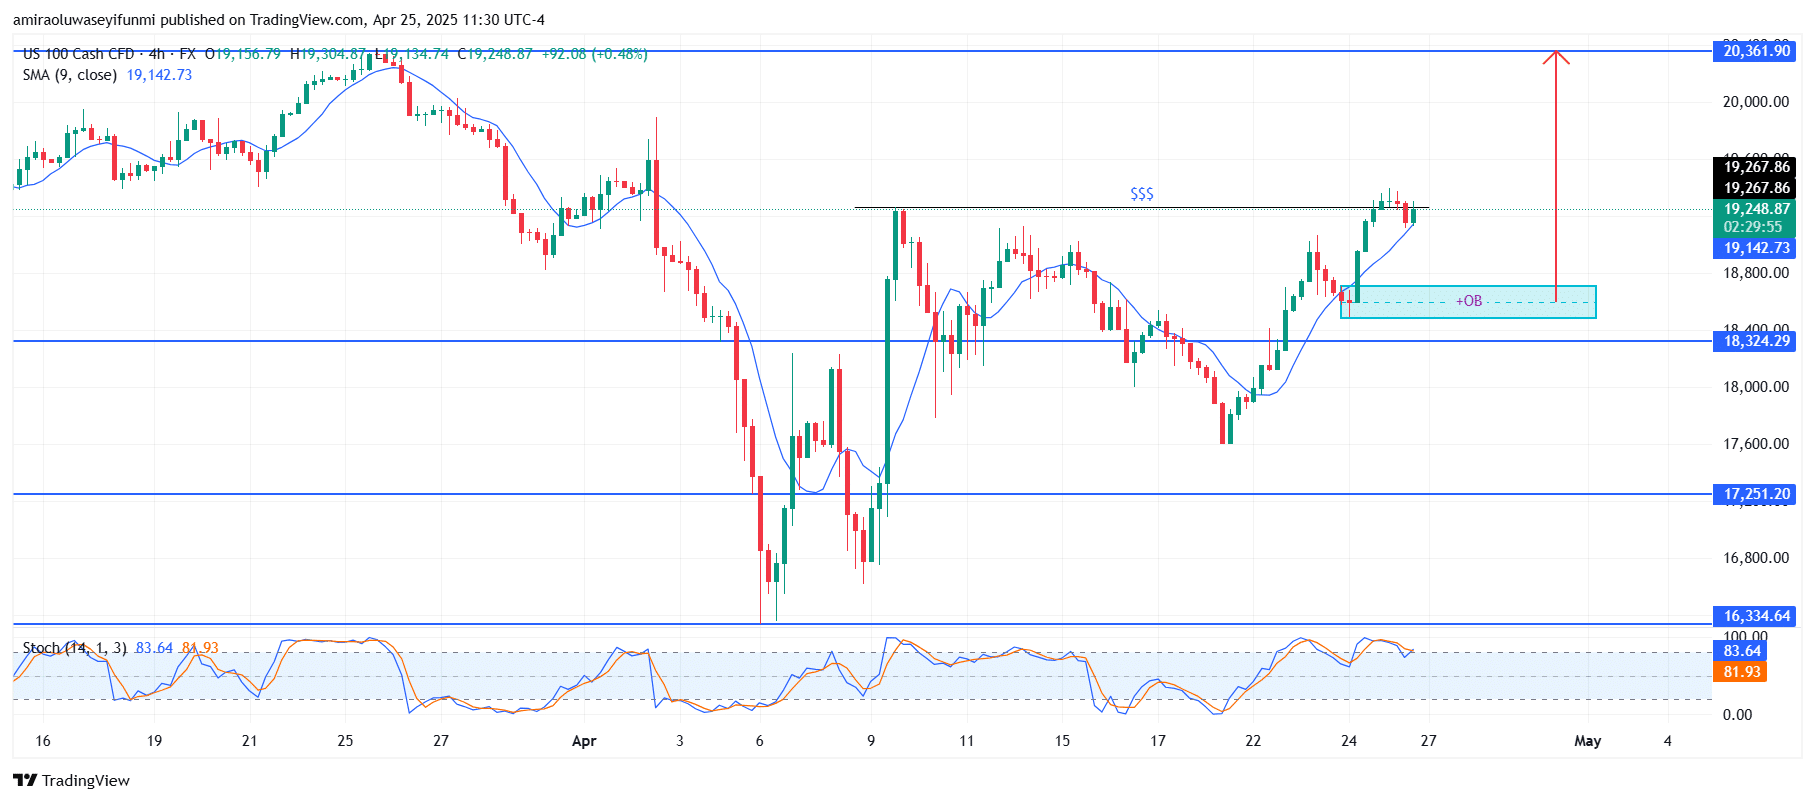
NAS100 Short-Term Trend: Bullish
On the four-hour chart, the short-term trend is bullish, with the index trading above the 9-period SMA, currently near $19,140. Recently, NAS100 broke above the previous swing high at $19,270, confirming near-term strength.
A bullish Order Block (OB) between $18,320 and $18,400 serves as a support zone should the price pull back. The next upside objective aligns with the higher time frame resistance around $20,360. This is seen in forex signals.
Note: Learn2.trade is not a financial advisor. Do your research before investing your funds in any financial asset, product, or event. We are not responsible for your investment results.
Trade on MT4 with Leverage up to 1:500! Trade on MT4 with Leverage up to 1:500!
X
We use cookies to ensure that we give you the best experience on our website. If you continue to use this site we will assume that you are happy with it.