NAS100 Analysis – August 3
NAS100 faces rejection as momentum weakens near key resistance. The NAS100 index has entered a corrective phase following an extended bullish rally, with recent price action sharply deviating from its upward trend. The daily candle closed decisively below the 9-day Simple Moving Average (SMA) at $23,240, a crucial short-term support level, indicating rising bearish sentiment. Additionally, the Relative Strength Index (RSI) has declined from near overbought levels to 47.61, reflecting diminishing bullish strength and increasing potential for continued downward movement. This shift in momentum comes after the index failed to sustain its breakout above the $24,050 resistance zone.
NAS100 Key Levels
Resistance Levels: $24,050, $25,000, $26,040
Support Levels: $22,140, $20,360, $18,320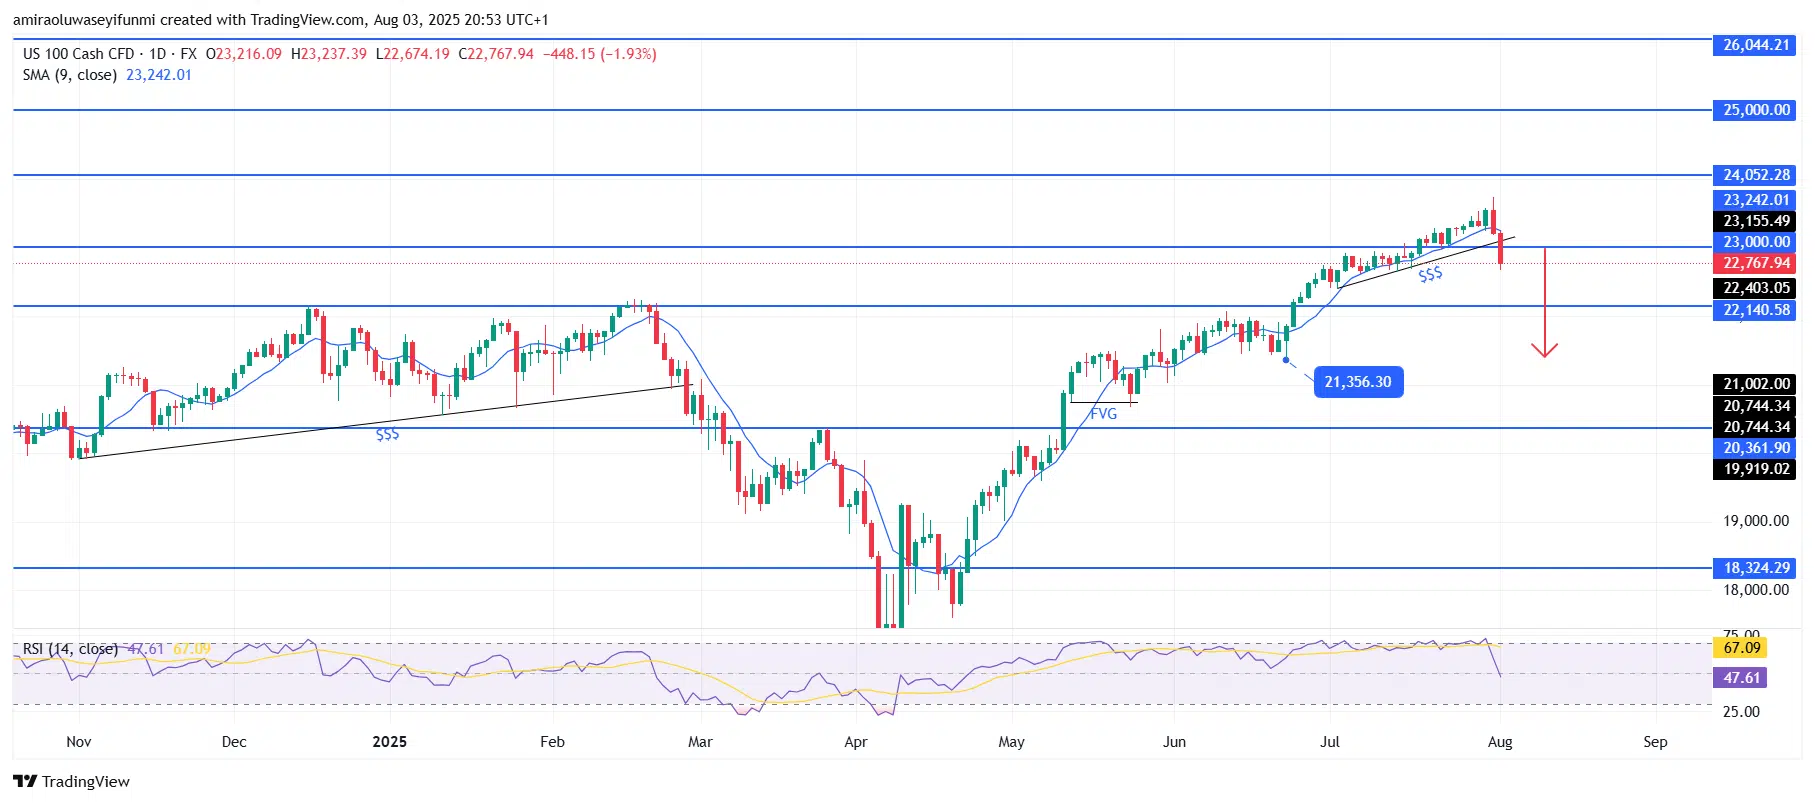
NAS100 Long-Term Trend: Bearish
Technically, price has breached the $23,000 psychological support level with a large bearish candle, highlighting strong selling interest. This breakdown followed a double rejection near the $24,050 zone, a historically significant level that has acted as both support and resistance. Price action revealed a clear drop through a prior liquidity area, suggesting that smart money is exiting long positions. Furthermore, the breakdown confirms a transition from a sequence of higher highs to lower lows, indicating structural weakness in the market.
Given the forceful decline, NAS100 is now positioned to retest lower support levels, with $22,140 as the immediate target. If this level fails to hold, the next key support lies around $21,000, aligning with previous accumulation zones observed in May. Should bearish momentum persist, deeper pullbacks toward $20,360 or even $19,920 could unfold. However, a brief consolidation above $22,140 might trigger a temporary relief bounce before the downtrend resumes, with forex signals pointing toward further bearish continuation.
NAS100 Short-Term Trend: Bearish
NAS100 has broken below its ascending trendline and critical support at $23,000, confirming the prevailing bearish momentum. Price is now trading beneath the 9-period SMA, reinforcing ongoing downward pressure.
The RSI remains in oversold territory, indicating persistent bearish strength despite the possibility of minor short-term rebounds. The next significant support level is located near $22,140, which aligns with the projected downside target.
Make money without lifting your fingers: Start using a world-class auto trading solution
How To Buy Lucky Block – Guide, Tips & Insights | Learn 2 Trade
Note: Learn2.trade is not a financial advisor. Do your research before investing your funds in any financial asset, product, or event. We are not responsible for your investment results.
- Broker
- Min Deposit
- Score
- Visit Broker

- Award-winning Cryptocurrency trading platform
- $100 minimum deposit,
- FCA & Cysec regulated

- 20% welcome bonus of upto $10,000
- Minimum deposit $100
- Verify your account before the bonus is credited
- Fund Moneta Markets account with a minimum of $250
- Opt in using the form to claim your 50% deposit bonus
Learn to Trade
Never Miss A Trade Again

Signal Notification
Real-time signal notifications whenever a signal is opened, closes or Updated

Get Alerts
Immediate alerts to your email and mobile phone.

Entry Price Levels
Entry price level for every signal Just choose one of our Top Brokers in the list above to get all this free.