NAS100 Analysis – July 27
NAS100 is approaching a cautious phase due to overextension and its proximity to a key trendline. In recent weeks, the index has maintained consistent bullish momentum, forming a series of higher highs and higher lows above the 9-day Simple Moving Average (SMA), which currently stands at $23,120. However, momentum indicators like the Relative Strength Index (RSI), now around 69.94, suggest the asset is entering overbought territory. This confluence near the psychological resistance at $23,500 hints at a possible weakening of bullish pressure. The RSI’s approach to the 70-threshold further indicates a potential bearish correction, especially as price action begins to diverge from its typical trajectory.
NAS100 Key Levels
Resistance Levels: $23,000, $24,050, $25,000
Support Levels: $22,140, $20,360, $18,320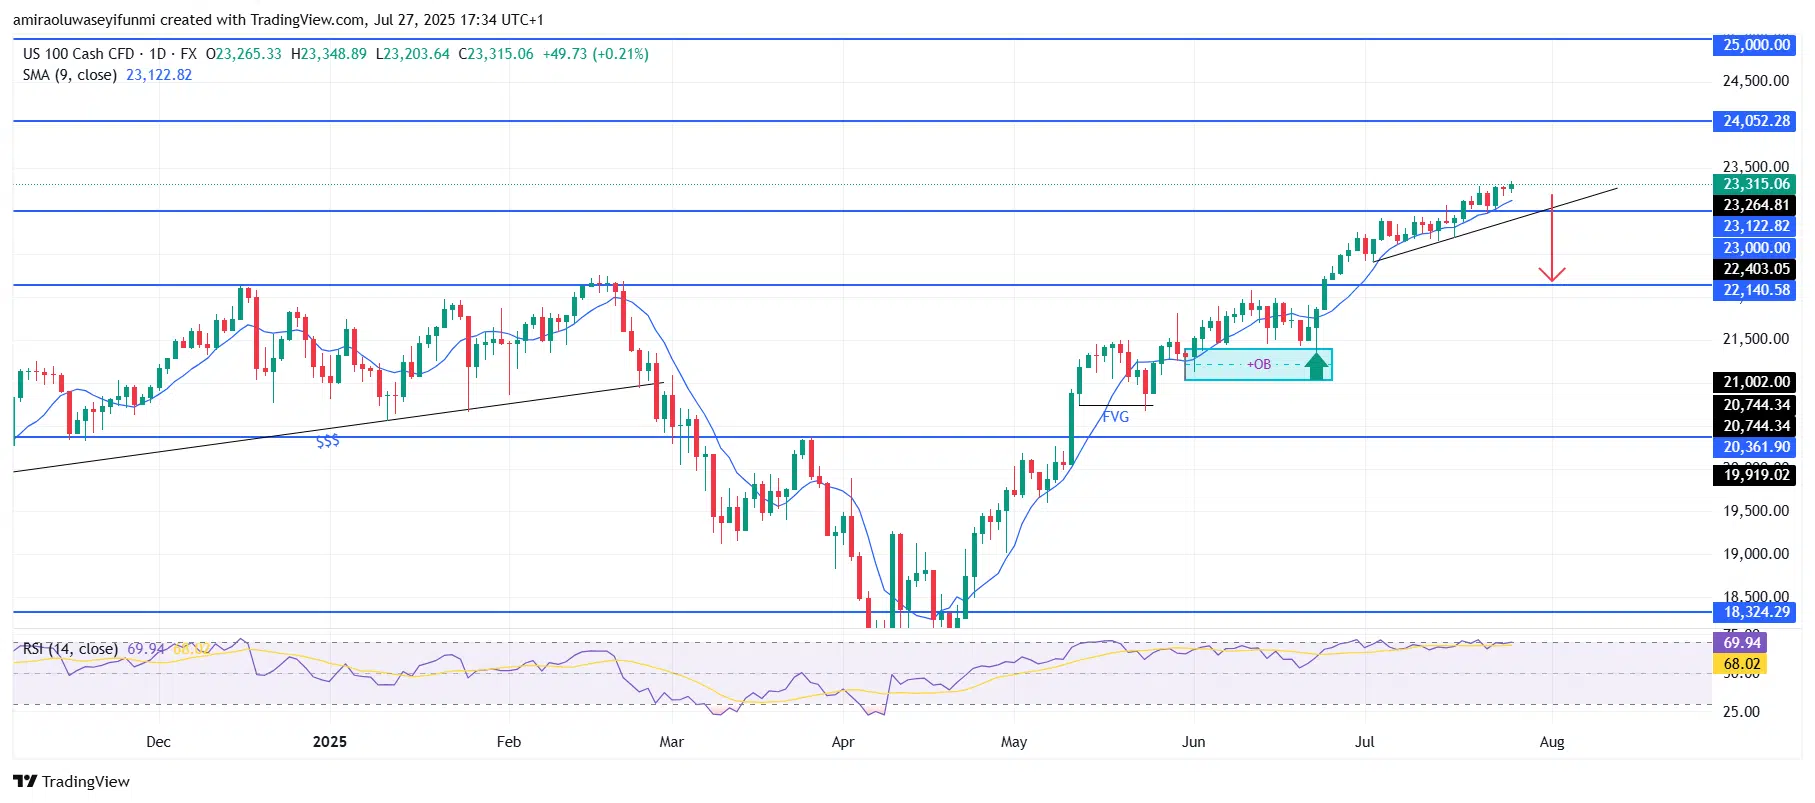
NAS100 Long-Term Trend: Bullish
From a technical standpoint, price is now testing an ascending trendline and hovering slightly above a significant horizontal level at $23,264. A break below this zone could indicate a rejection of bullish momentum and may trigger the start of a corrective phase. Past liquidity gaps (FVG) and the mitigation of an order block near $22,400 further support the likelihood of price revisiting these demand zones for rebalancing.
If the market fails to hold above $23,260, the next key level to watch is the $23,000 mark. The combination of resistance near $23,500, an overbought RSI, and vulnerability at the trendline suggests that NAS100 may be due for a short-term bearish correction. A break below the rising support could open the door for a move toward $22,400, with $22,140 as the immediate downside target. If the correction deepens, price might even retrace into the fair value gap at $21,000 before the overall bullish structure regains strength. Such a pullback would help resolve market inefficiencies and recharge bullish momentum, potentially setting the stage for a more sustainable rally toward the $24,000 region. This scenario offers useful insights for traders relying on forex signals.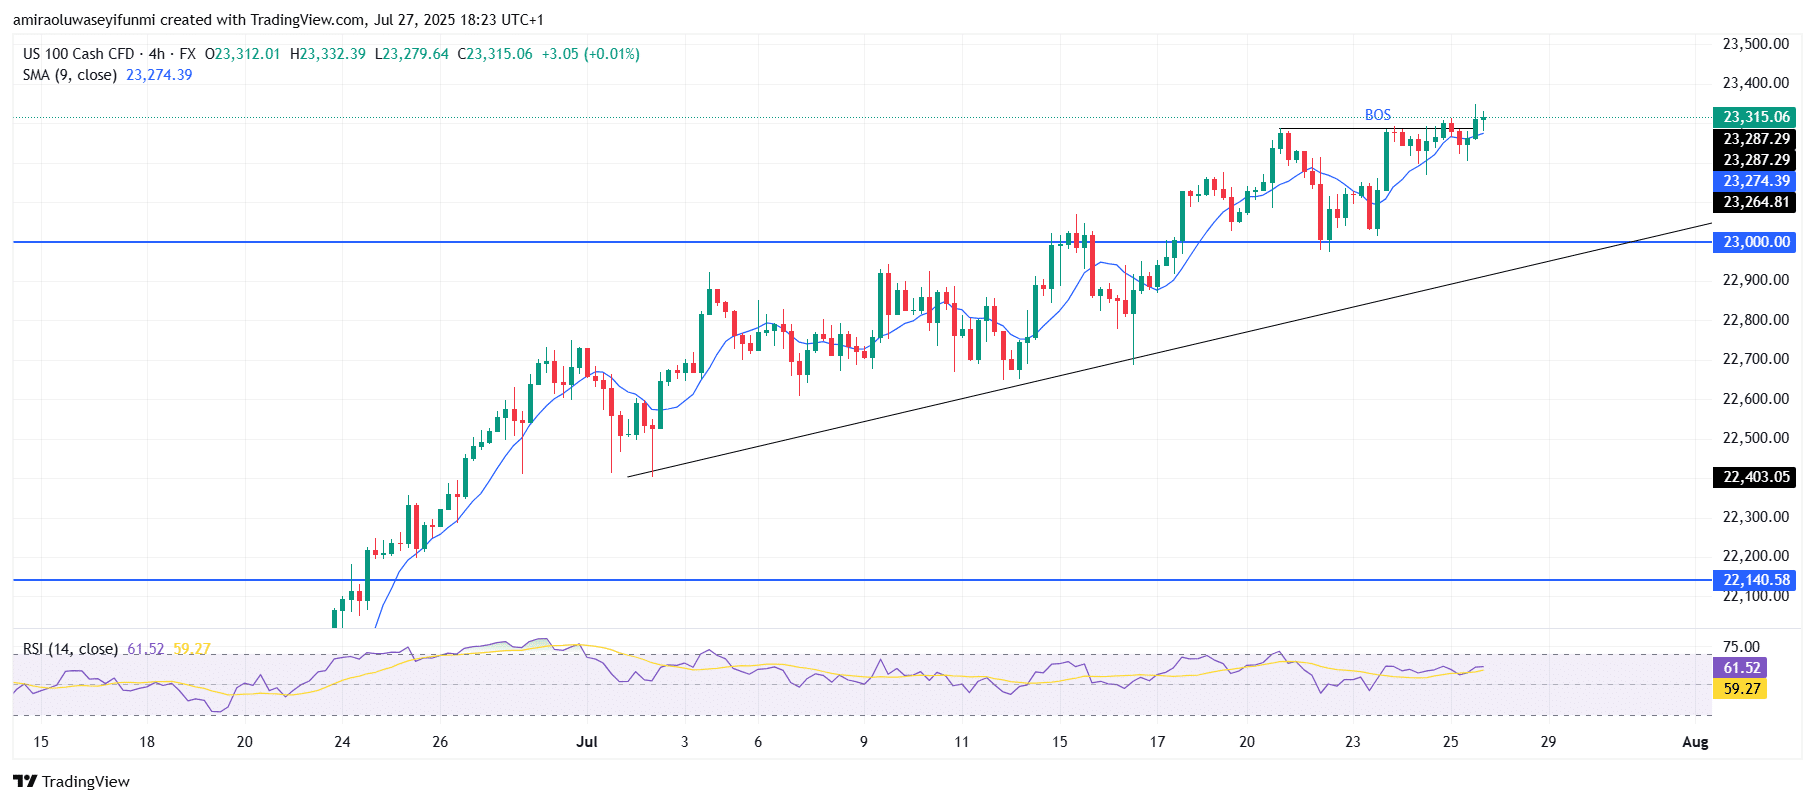
NAS100 Short-Term Trend: Bullish
On the 4-hour chart, NAS100 continues to display a bullish structure, forming higher lows along an ascending trendline. Price recently broke structure (BOS) above the $23,290 level, confirming ongoing bullish sentiment. The 9-period SMA at $23,270 supports this upward move, while the RSI at 61.52 indicates there’s still room for more gains. If buying pressure persists above $23,320, the index could aim for the $23,500 resistance zone next.
Make money without lifting your fingers: Start using a world-class auto trading solution
How To Buy Lucky Block – Guide, Tips & Insights | Learn 2 Trade
Note: Learn2.trade is not a financial advisor. Do your research before investing your funds in any financial asset, product, or event. We are not responsible for your investment results.
- Broker
- Min Deposit
- Score
- Visit Broker

- Award-winning Cryptocurrency trading platform
- $100 minimum deposit,
- FCA & Cysec regulated

- 20% welcome bonus of upto $10,000
- Minimum deposit $100
- Verify your account before the bonus is credited
- Fund Moneta Markets account with a minimum of $250
- Opt in using the form to claim your 50% deposit bonus
Learn to Trade
Never Miss A Trade Again

Signal Notification
Real-time signal notifications whenever a signal is opened, closes or Updated

Get Alerts
Immediate alerts to your email and mobile phone.

Entry Price Levels
Entry price level for every signal Just choose one of our Top Brokers in the list above to get all this free.