Market Analysis – July 22
NAS100 has shown strong bullish momentum, pushing the price toward the 23,500.00 resistance level. After facing substantial bearish pressure earlier in the year, the index has now transitioned into a bullish phase, characterized by aggressive breakouts and consistent upward movement.
NASDAQ Key Levels
Demand Levels: 22050.00, 20500.00, 19200.00
Supply Levels: 23500.00, 24500.00, 25800.00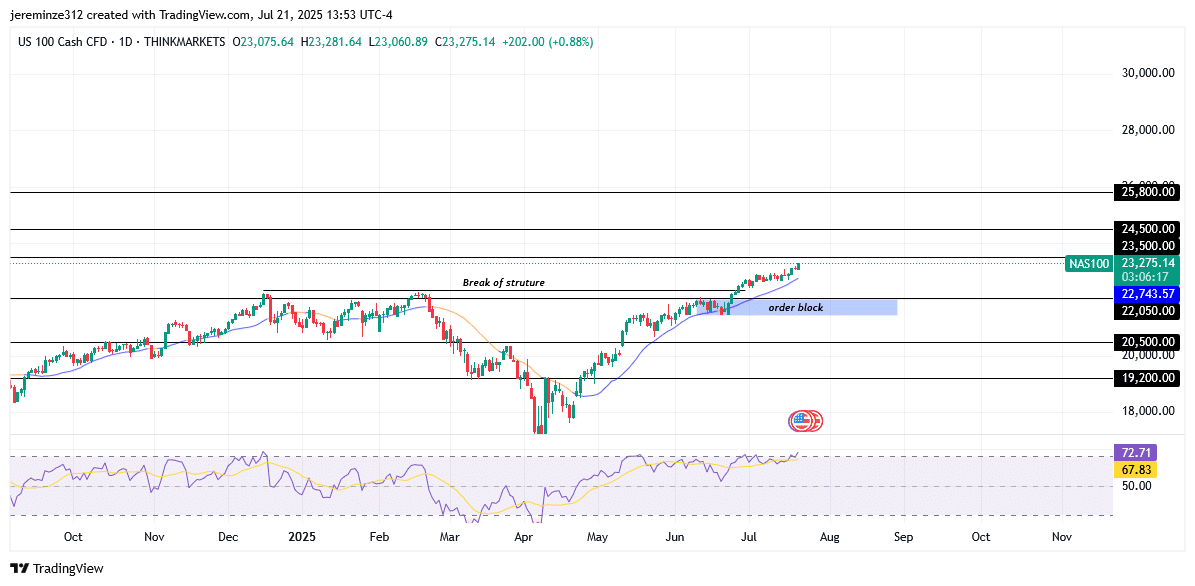
NASDAQ 100 Long-Term Trend: Bullish
The initial bearish movement in NAS100 began after a significant high formed in early 2025, leading to a sharp decline that extended into April. This downward trend was eventually reversed by a strong bullish response, which broke above the previous high and established a new upward market structure. The bullish break of structure confirmed a directional change and highlighted buyers’ increasing dominance.
After this breakout, NAS100 rallied beyond the 22,050.00 demand level without any visible reaction at the daily order block—reflecting intense buying momentum. Despite the daily Relative Strength Index (RSI) entering the overbought zone, which may indicate a short-term correction, the overall market trend and the daily Moving Average remain aligned in a bullish direction. Traders should monitor the 22,500.00 area as it could serve as a potential point for short-term reversal, especially when using forex signals to navigate volatility.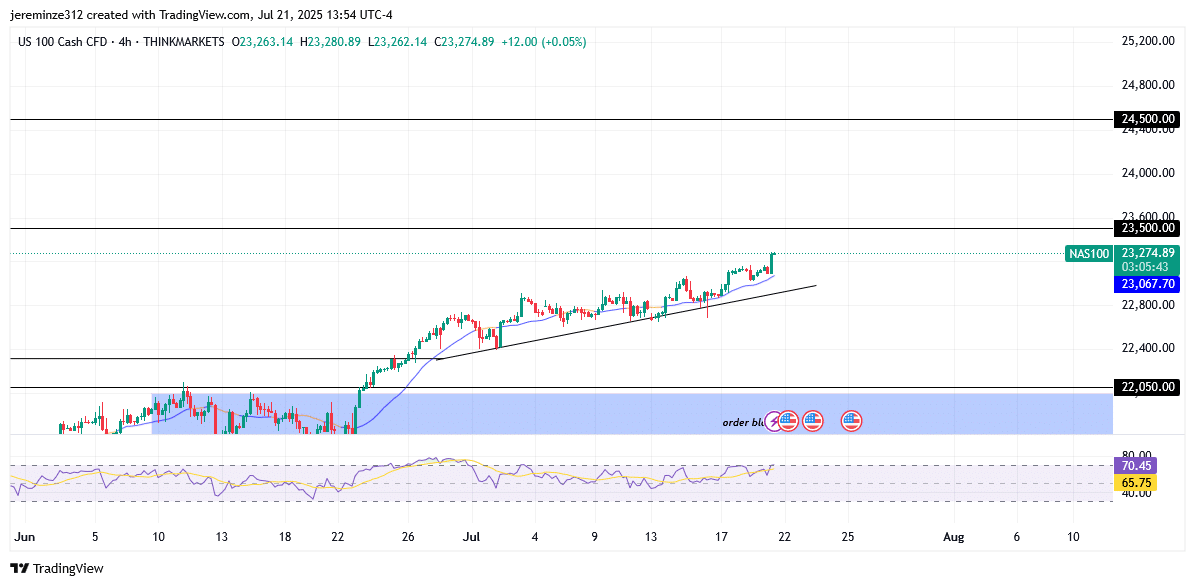
NASDAQ 100 Short-Term Trend: Bullish
In the short term, NAS100 continues to sustain its bullish momentum above the 22,050.00 support as it approaches the 23,500.00 resistance level. On the 4-hour chart, RSI readings remain in the overbought zone, suggesting a possible bearish retracement. A confirmed shift to a bearish trend would require a break below the current trend line. Until such a move occurs, the bulls maintain control of the market.
Make money without lifting your fingers: Start using a world-class auto trading solution
How To Buy Lucky Block – Guide, Tips & Insights | Learn 2 Trade
Note: Learn2.trade is not a financial advisor. Do your research before investing your funds in any financial asset, product, or event. We are not responsible for your investment results.
- Broker
- Min Deposit
- Score
- Visit Broker

- Award-winning Cryptocurrency trading platform
- $100 minimum deposit,
- FCA & Cysec regulated

- 20% welcome bonus of upto $10,000
- Minimum deposit $100
- Verify your account before the bonus is credited
- Fund Moneta Markets account with a minimum of $250
- Opt in using the form to claim your 50% deposit bonus
Learn to Trade
Never Miss A Trade Again

Signal Notification
Real-time signal notifications whenever a signal is opened, closes or Updated

Get Alerts
Immediate alerts to your email and mobile phone.

Entry Price Levels
Entry price level for every signal Just choose one of our Top Brokers in the list above to get all this free.