

Monero (XMR) Price Analysis: August 29
When the bulls prevail over the bears and were able to break up the resistance level of $322, it may expose the price to the resistance levels of $361 and $401. The breakdown of the support level of $281 may decrease the price down to the support levels of $244, and $189 price levels.
Key Levels:
Resistance Levels: $322, $361, $401
Support Levels: $281, $244, $189
XMRUSD Long-term Trend: Ranging
On the daily chart, XMRUSD is on the ranging movement. Monero was on the bullish trend last two weeks and the price reached the resistance level at $322. The bulls’ pressure could not break up the $322 level due to the opposition from the bears. The price commences consolidation movement within the range of $322 and $281 levels.
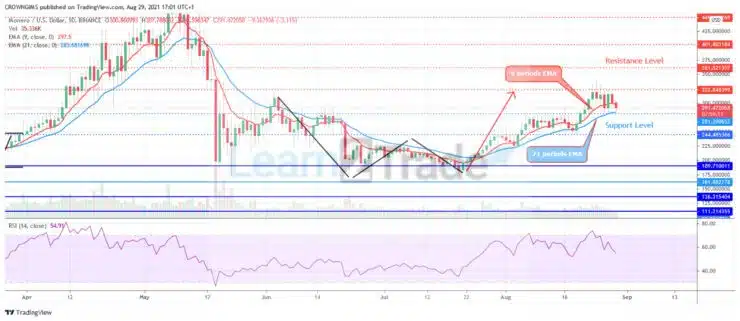
The bears are trying to push the price away from the resistance level of $322 as Buyers are exerting pressure on the Monero market. The price is trading between the 9-day EMA and the 21-day EMA on the daily chart. When the bulls prevail over the bears and were able to break up the resistance level of $322, it may expose the price to the resistance levels of $361 and $401. The break down of the support level of $281 may decrease the price down to the support levels of $244, and $189 price levels.
XMRUSD Price Medium-term Trend: Ranging
Monero is ranging on 4-Hour chart. The bulls were able to push up the price to test the resistance level of $322 after passing thru the $281 level. The bulls lose the momentum when the price reached the resistance level of $322. It started a ranging movement within the $322 and 4281 price level.

The 9-day EMA is interlocked with the 21-day EMA and the price continue to hover around the two EMAs, which indicate that bulls’ and bears’ momentum is weak. The relative strength is at 40 levels with the signal line pointing down to indicate sell signal
You can purchase crypto coins here. Buy Tokens


