Don’t invest unless you’re prepared to lose all the money you invest. This is a high-risk investment and you are unlikely to be protected if something goes wrong. Take 2 minutes to learn more
Lucky Block – Guide, Tips & Insights | Learn 2 Trade appears to be setting up for potential expansion as buyers show signs of taking control amid ongoing market compression.
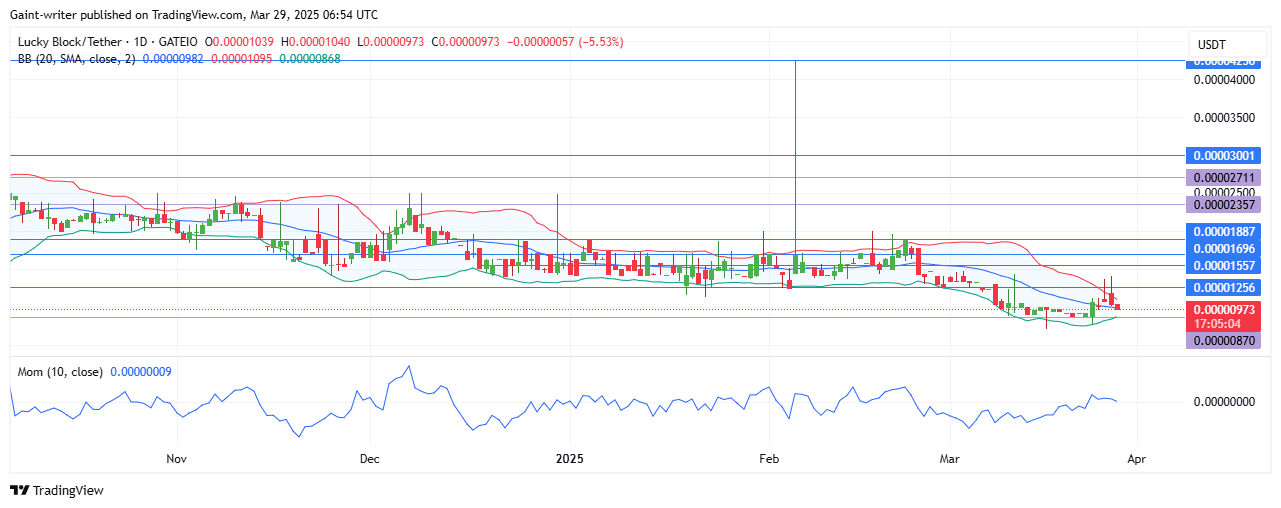
LBLOCKUSD Key Levels
Support Level: $0.00000880 , $0.00000980 Resistance Level: $0.00001960 ,$0.00001940
Lucky Block – Guide, Tips & Insights | Learn 2 Trade Long Term Trend: Bullish (Daily Chart)
After experiencing a slip from the $0.00001960 key level down to the $0.00000880 significant zone, buyers have continued to demonstrate relentless effort for recovery. March was challenging for the bulls, but as we enter April, there is renewed optimism in the market, with buyers eager to reclaim their strength.
The current market dynamics suggest that traders should be on the lookout for a potential bounce, signaling a recovery in buyer sentiment. The Parabolic SAR (Stop and Reverse) indicator indicates that buyers are showing increased interest in recovery, aligning with the overall bullish sentiment.
Additionally, the Bollinger Band indicator is preparing for price expansion on the daily chart, suggesting that a significant price movement may be on the horizon.
The buyers are regaining control, which bodes well for future price appreciation. The market dynamics indicate that if buyers can sustain their momentum, LBLOCK could potentially regain its bullish stance.
LBLOCK Medium-Term Trend: Bullish (4-Hour Chart)
The outlook for Lucky Block – Guide, Tips & Insights | Learn 2 Trade suggests that buyers are well-positioned for a potential recovery and expansion. With the price currently at $0.00000960, this level serves as a foundation for an upward move if buyers can maintain their strength.
Traders should closely monitor the Parabolic SAR and Bollinger Bands for any signs of continued bullish momentum. A successful bounce from the current level could lead to further upward movement, possibly aiming to break through the $0.00001960 resistance level.
Note: Learn2.trade is not a financial advisor. Do your research before investing your funds in any financial asset, product, or event. We are not responsible for your investment results.
Trade on MT4 with Leverage up to 1:500! Trade on MT4 with Leverage up to 1:500!
X
We use cookies to ensure that we give you the best experience on our website. If you continue to use this site we will assume that you are happy with it.

 LBLOCK Medium-Term Trend: Bullish (4-Hour Chart)
 LBLOCK Medium-Term Trend: Bullish (4-Hour Chart)


