AUDJPY pair is currently experiencing a bearish trend. The sellers are making significant efforts to penetrate deeper towards the 92.330 significant level. The market’s vibe has flipped, with buyers losing steam and sellers now calling the shots.
AUD/JPY Key Levels
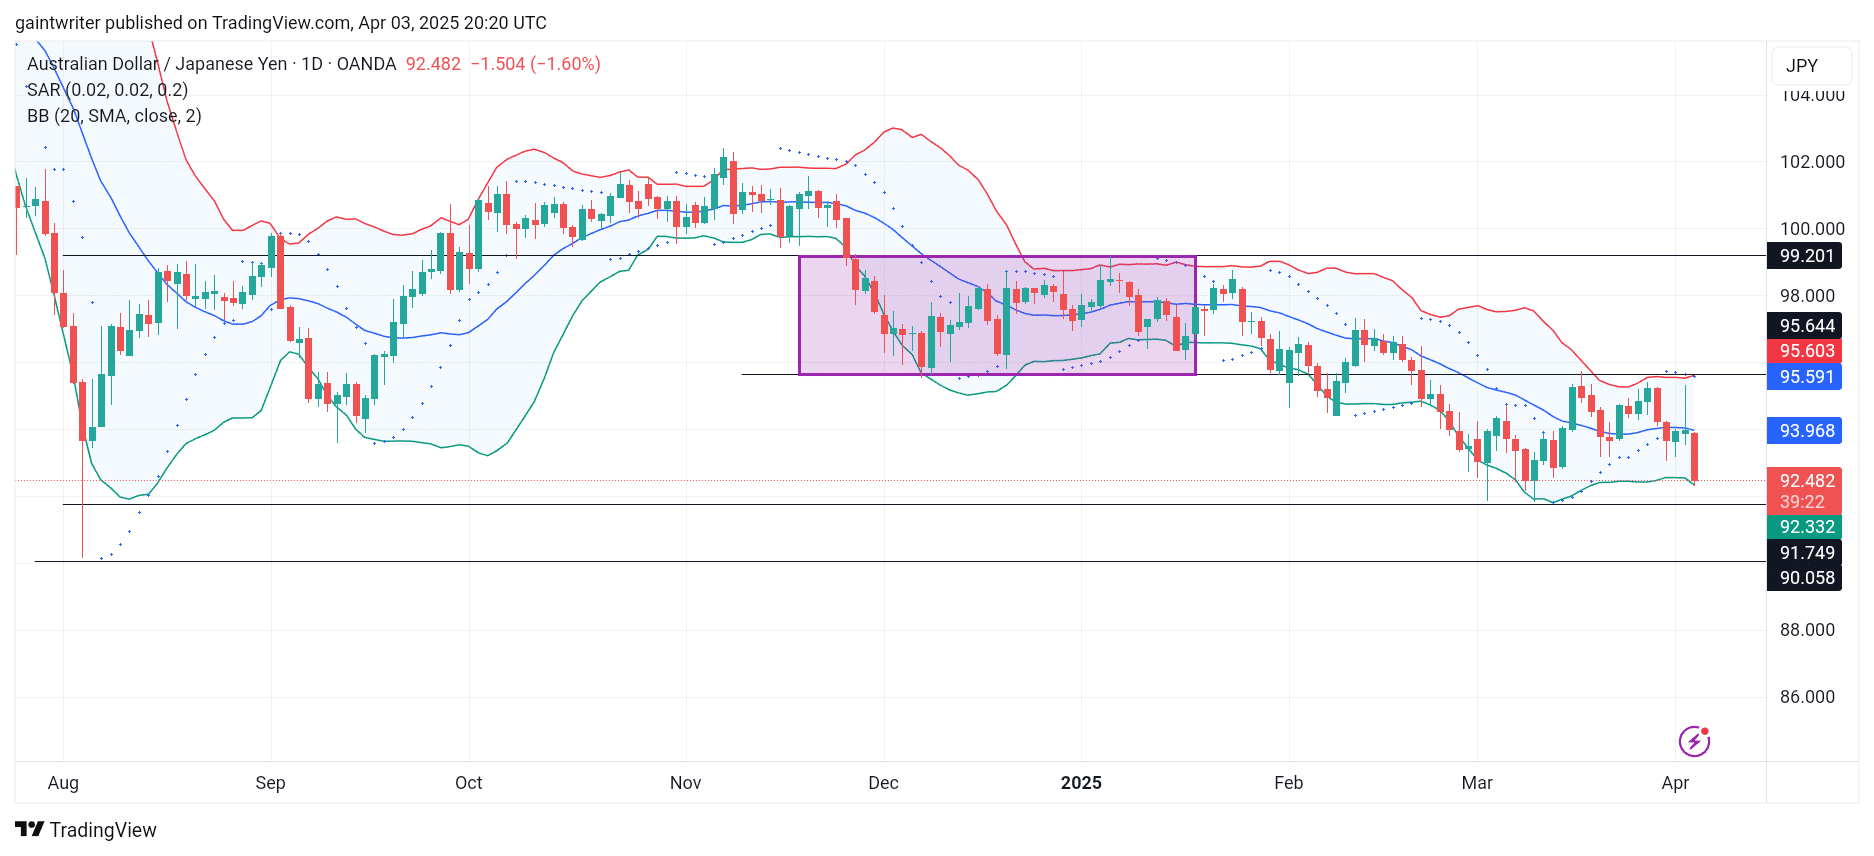
Support Level: 92.330 , 93.340 Resistance Level: 95.590 , 96.900
AUDJPY Long Term Trend: Bearish (Daily chart)
Bulls aimed to push through the 95.590 significant level but were ultimately forced out of the way. For months, AUD/JPY has struggled to make stronger moves, remaining suspended between the 95.590 and 92.330 levels. Currently, sellers are gradually looking to force a breakout, which could lead to further downward movement in the market.
The Bollinger Band indicator suggests that the market is experiencing stable volatility, which may indicate a buildup of price action. The Parabolic SAR (Stop and Reverse) indicator shows that seller momentum may be accelerating, reinforcing the bearish sentiment in the market. The bears are putting in considerable effort to breach the 92.320 key level. If they succeed, it could open the door for further declines. However, if sellers fail to maintain their momentum, the bulls may have an opportunity to bounce back towards the 95.950 key level.
AUDJPY Short-Term Trend: Bearish (4-hour chart)
The outlook for AUDJPY suggests that the market is at a critical juncture. Sellers are pushing hard to break below the 92.330 support level, which could set the stage for additional bearish movements.
Traders should closely monitor the Parabolic SAR and Bollinger Bands for indications of momentum shifts. A successful breach of the 92.320 level could signal a stronger downtrend.
Trade on MT4 with Leverage up to 1:500! Trade on MT4 with Leverage up to 1:500!
X
We use cookies to ensure that we give you the best experience on our website. If you continue to use this site we will assume that you are happy with it.

 AUDJPY Short-Term Trend: Bearish (4-hour chart)
 AUDJPY Short-Term Trend: Bearish (4-hour chart)


