Don’t invest unless you’re prepared to lose all the money you invest. This is a high-risk investment and you are unlikely to be protected if something goes wrong. Take 2 minutes to learn more
Lucky Price Forecast – March 12th
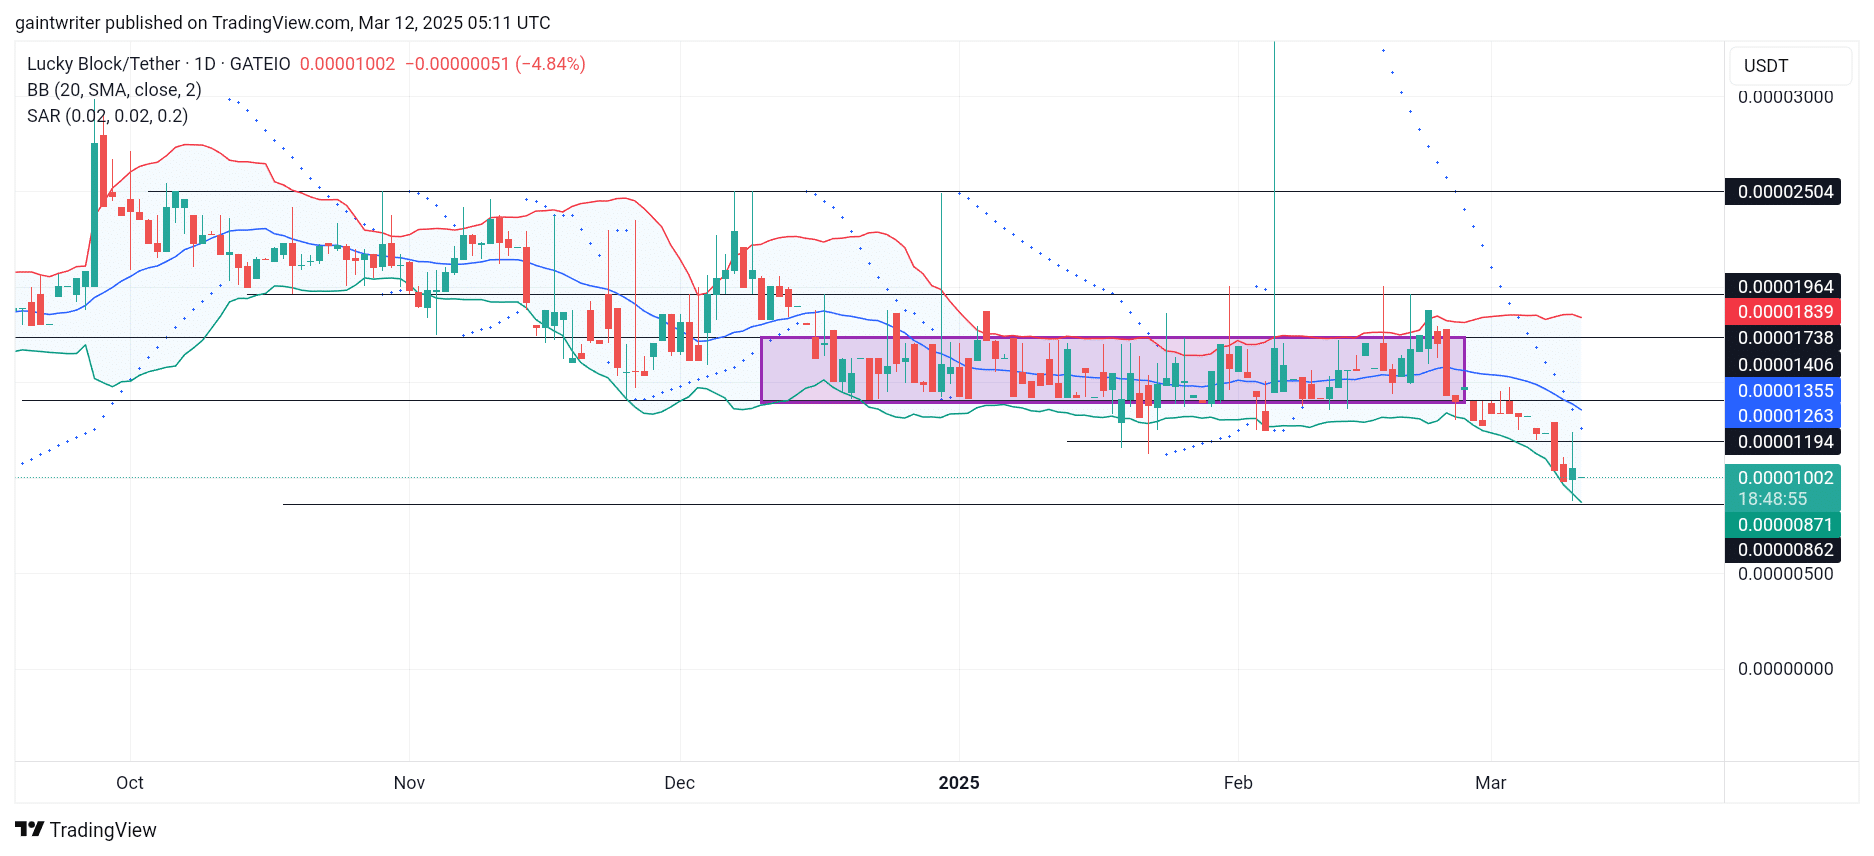
Lucky Block – Guide, Tips & Insights | Learn 2 Trade price forecast shows the market is currently witnessing a resurgence of buyer confidence as the market stabilizes around the key area of $0.000008600.
LBLOCKUSD Key Levels
Support Level: $0.000008600 Resistance Level: $0.00001000
Sellers have made attempts to breach the $0.00001000 level. However, they appear to be backing away, giving buyers a chance to re-establish their stance. With sellers previously pressing lower from the $0.00001730 market level, the current environment favours buyers looking to initiate a strong reversal.
The market dynamics indicate that buyers are not easily pulling out, instead seeking opportunities to regain control and push prices higher. The widening of the Bollinger Bands indicates increased market volume. The indicator suggests that volatility may be on the rise as buyers step back into the scene. This development is a positive sign for a potential bullish recovery.
Additionally, the Parabolic SAR (Stop and Reverse) indicator is sliding lower, reflecting that sellers have held the steering wheel for an extended period. However, the current market sentiment hints at a potential reversal in the coming days as buyers seek to capitalise on the opportunity.
In the daily time frame, bulls are poised for recovery, and the Bollinger Bands indicate that buyers have a window to push back into the market. The Parabolic SAR may soon signal a potential move for reversal, further affirming the bullish outlook.
In the near term, Lucky Block – Guide, Tips & Insights | Learn 2 Trade appears well-positioned for recovery as buyers gather strength around the $0.000008600 level. A successful push above the $0.00001000 resistance could trigger further momentum, paving the way for a more substantial upward movement.
Traders should keep a close eye on the Bollinger Bands and the Parabolic SAR for signals of increased buying activity and the potential for a bullish reversal. The current market dynamics suggest that the bulls are ready to take action.
Note: Learn2.trade is not a financial advisor. Do your research before investing your funds in any financial asset, product, or event. We are not responsible for your investment results.
Trade on MT4 with Leverage up to 1:500! Trade on MT4 with Leverage up to 1:500!
X
We use cookies to ensure that we give you the best experience on our website. If you continue to use this site we will assume that you are happy with it.

 Lucky Block – Guide, Tips & Insights | Learn 2 Trade Medium Term: Bullish (4-hour chart)


