Don’t invest unless you’re prepared to lose all the money you invest. This is a high-risk investment and you are unlikely to be protected if something goes wrong. Take 2 minutes to learn more
Lucky Block – Guide, Tips & Insights | Learn 2 Trade buyer’s price forecast shows buyers are showing renewed strength, pushing back against sellers and attempting to establish a firm footing.
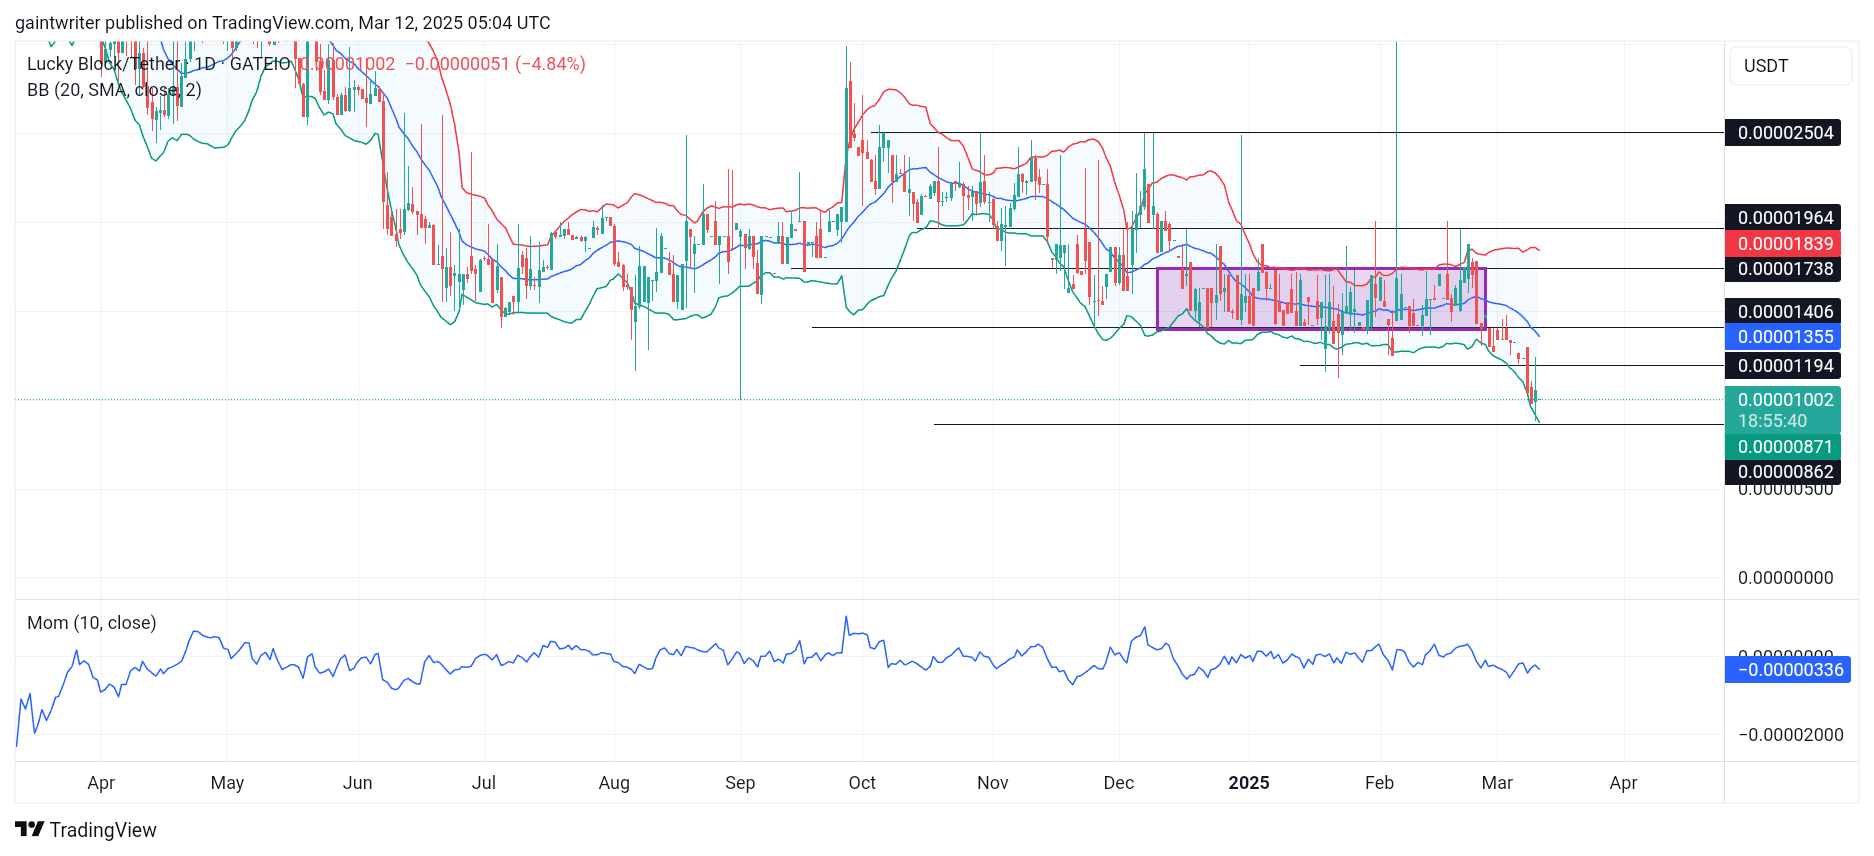
LBLOCK/USD Key Levels:
Support Levels: $0.00001000, $0.000001830 Resistance Levels: $0.00001830, $0.00002000
LBLOCK Long Term Trend: Bullish (Daily Chart)
The beginning of the month saw strong selling pressure, pushing buyers back from the $0.00001830 key area. However, buyers are now showing resilience, and attempting to recover. The long-term trend is currently uncertain but showing signs of a potential bullish reversal if buyers can maintain momentum.
The recent price action indicates a battle for control between bulls and bears. The sellers initially capitalised on the market’s vulnerability, leading to a significant pullback. However, the buyers’ refusal to yield suggests underlying strength.
Market participants are now closely observing whether the $0.00001000 support level can hold. A sustained defense of this level would reinforce the possibility of a bullish reversal. If the market experiences a positive shift, it could provide the necessary catalyst for Lucky Block – Guide, Tips & Insights | Learn 2 Trade’s recovery.
The Bollinger Band indicator had previously shown a lack of expansion, reflecting the sellers’ dominance. However, there are now signs of a gradual recovery, indicating renewed buyer interest. The Momentum indicator suggests buyers are gathering strength, potentially leading to a push higher. For buy traders, this could represent an opportunity to capitalize on the dip. A stronghold above the $0.00001000 level is critical for bullish continuation.
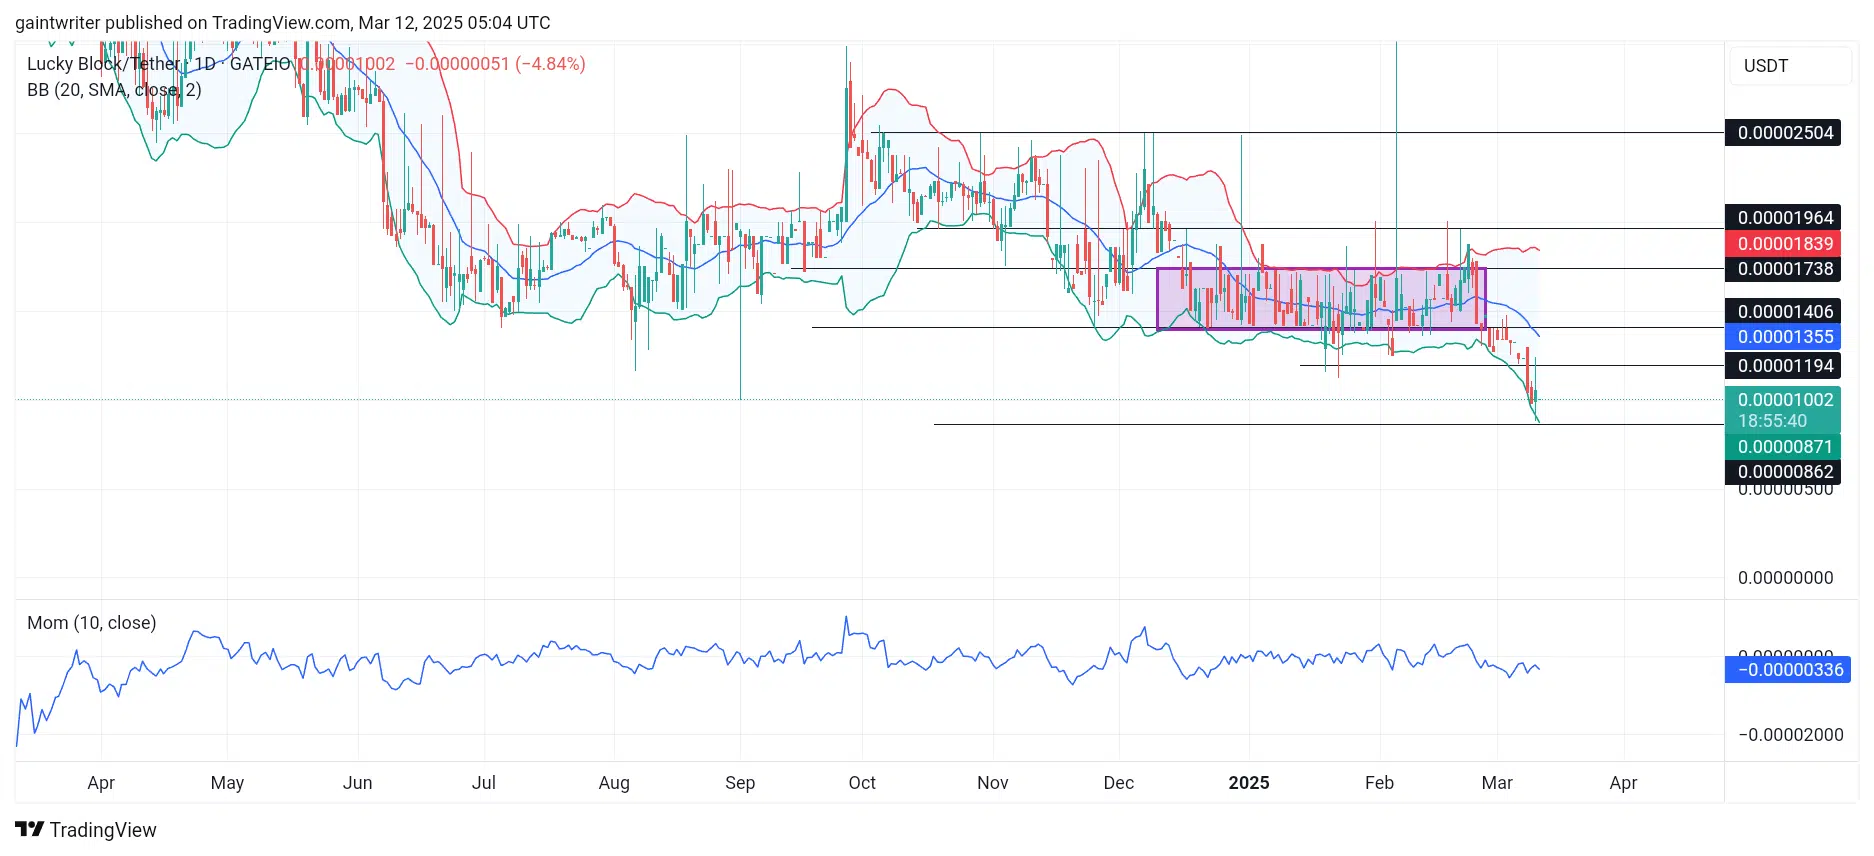
Lucky Block – Guide, Tips & Insights | Learn 2 Trade Medium Term Trend: Bullish (4-hour chart)
In the short time frame, there is a gradual buildup of buying pressure. A decisive break above the middle band of the Bollinger Bands could counteract the prevailing sell sentiment and signal a bullish shift.
Buyers need to maintain strong determination to achieve this breakthrough. If buyers can break the mid-band, then a retest of the previous resistance level of $0.00001830 is possible.
Note: Learn2.trade is not a financial advisor. Do your research before investing your funds in any financial asset, product, or event. We are not responsible for your investment results.
Trade on MT4 with Leverage up to 1:500! Trade on MT4 with Leverage up to 1:500!
X
We use cookies to ensure that we give you the best experience on our website. If you continue to use this site we will assume that you are happy with it.
 Lucky Block – Guide, Tips & Insights | Learn 2 Trade Medium Term Trend: Bullish (4-hour chart)
 Lucky Block – Guide, Tips & Insights | Learn 2 Trade Medium Term Trend: Bullish (4-hour chart)


