Don’t invest unless you’re prepared to lose all the money you invest. This is a high-risk investment and you are unlikely to be protected if something goes wrong. Take 2 minutes to learn more
Lucky Block – Guide, Tips & Insights | Learn 2 Trade Price Forecast – Expert Analysis & Trading Tips | Learn 2 Trade – Expert Analysis & Trading Tips | Learn 2 Trade – August 20th
The Lucky Block – Guide, Tips & Insights | Learn 2 Trade price forecast suggests that buyers are likely to continue their bullish momentum in the market.
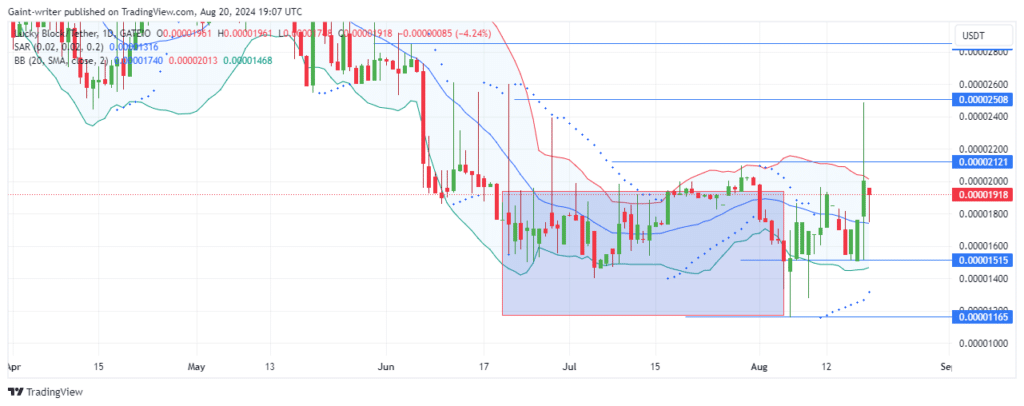
LBLOCKUSD Long Term Trend: Bullish (1-Day Chart)
Key Levels
Support Levels: $0.00001340, $0.00001420
Resistance Levels: $0.00002530, $0.00002110
Lucky Block – Guide, Tips & Insights | Learn 2 Trade Price Forecast – Expert Analysis & Trading Tips | Learn 2 Trade – Expert Analysis & Trading Tips | Learn 2 Trade: LBLOCKUSD Outlook
After reaching the $0.00002500 level, the BTCUSD cryptocurrency has experienced some price suppression, which could be a classic example of a liquidity grab. Smart money might have used this higher price point to offload positions, capitalizing on the liquidity generated by the breakout. As the price begins to decline, it suggests the market is potentially exiting longs and preparing for a return to a more balanced or lower level.
The momentum from buyers has suddenly slowed, indicating caution and a wait for another opportunity to build stronger positions. This pause can be interpreted as smart money accumulating orders at lower prices. Bitcoin traders might look to the $0.00001800 support level, where previous volatility has been observed, as a potential area for renewed buying interest.
The Bollinger Bands, reflecting the market’s tenacity and potential for expansion, align with the idea that smart money may be preparing for another push higher. This could happen if enough liquidity is accumulated below the current price levels. The Parabolic SAR, acting as support, indicates that while there is some downward pressure, the overall trend may still favor the bulls.
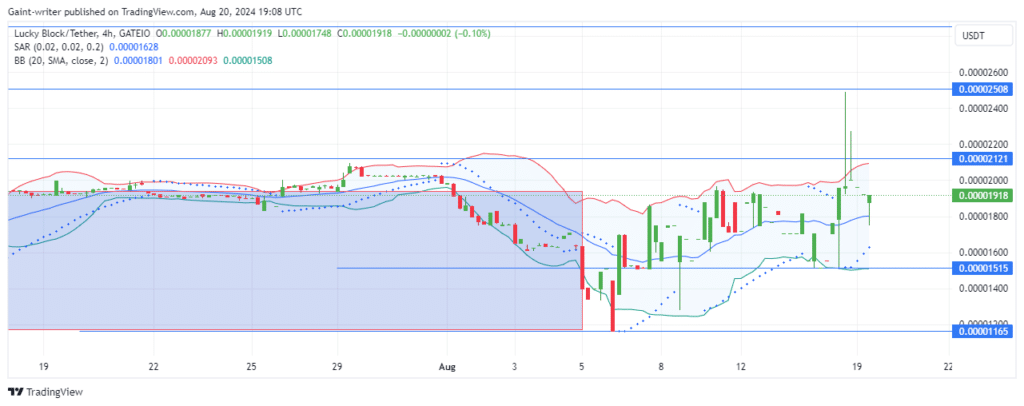
Lucky Block – Guide, Tips & Insights | Learn 2 Trade Medium Term Trend: Bullish (4-hour chart)
The market’s volatility between $0.00002100 and $0.00001530 suggests a range-bound environment where liquidity is being built up. If buyers remain focused and the indicators continue to support a bullish outlook, another attempt to break above $0.00002100 is likely.
How To Buy Lucky Block – Guide, Tips & Insights | Learn 2 Trade
Note: Learn2.trade is not a financial advisor. Do your research before investing your funds in any financial asset, product, or event. We are not responsible for your investment results.
- Broker
- Min Deposit
- Score
- Visit Broker
- Award-winning Cryptocurrency trading platform
- $100 minimum deposit,
- FCA & Cysec regulated
- 20% welcome bonus of upto $10,000
- Minimum deposit $100
- Verify your account before the bonus is credited
- Fund Moneta Markets account with a minimum of $250
- Opt in using the form to claim your 50% deposit bonus
Learn to Trade
Never Miss A Trade Again

Signal Notification
Real-time signal notifications whenever a signal is opened, closes or Updated

Get Alerts
Immediate alerts to your email and mobile phone.

Entry Price Levels
Entry price level for every signal Just choose one of our Top Brokers in the list above to get all this free.


