Don’t invest unless you’re prepared to lose all the money you invest. This is a high-risk investment and you are unlikely to be protected if something goes wrong. Take 2 minutes to learn more
Lucky Block – Guide, Tips & Insights | Learn 2 Trade Price Forecast – Expert Analysis & Trading Tips | Learn 2 Trade – Expert Analysis & Trading Tips | Learn 2 Trade – October 29th
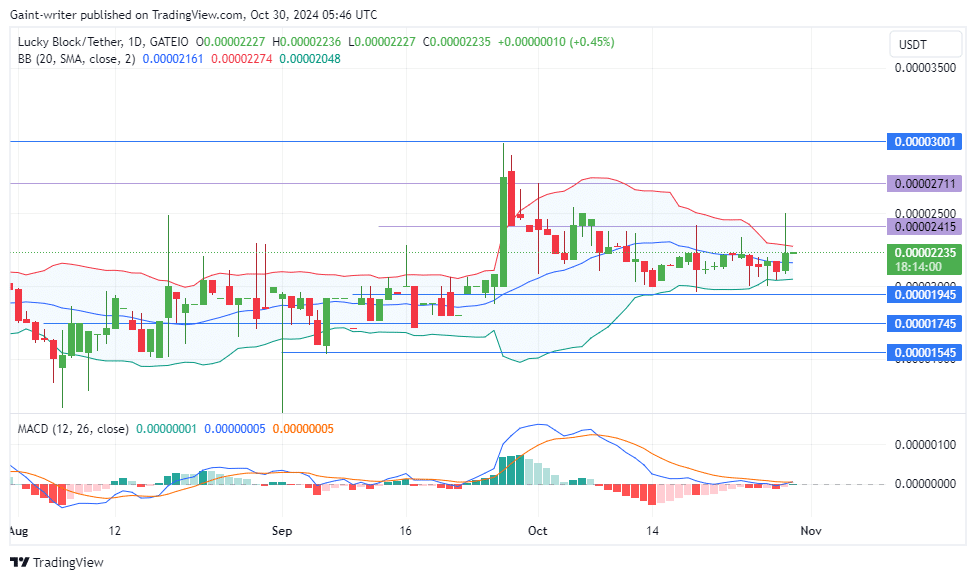
The Lucky Block – Guide, Tips & Insights | Learn 2 Trade price forecast shows the market shows a resurgence of buyer momentum as prices push above the $0.00002400 level.
LBLOCKUSD Long-Term Trend: Bullish (Daily Chart)
Key Levels
Support Levels: $0.00002200, $0.00002300
Resistance Levels: $0.00002500, $0.00003000
Lucky Block – Guide, Tips & Insights | Learn 2 Trade Price Forecast – Expert Analysis & Trading Tips | Learn 2 Trade – Expert Analysis & Trading Tips | Learn 2 Trade: LBLOCKUSD Outlook
The increased bullish activity is noticeable as buyers continuously press for expansion. While the Lucky Block – Guide, Tips & Insights | Learn 2 Trade market is consolidating, the push past $0.00002400 highlights an ongoing bullish drive. However, the Bollinger Band remains compressed, indicating reduced volatility. This suggests that a potential breakout could be on the horizon, with buyers aiming to capitalize on the buildup in momentum.
The MACD (Moving Average Convergence Divergence) indicator is still positioned near the midline, underscoring a cautious market sentiment. However, with the current bullish synergy, a MACD shift could further support the bullish outlook if it diverges upward. This potential divergence may act as a signal for stronger LBLOCK price movement as buyers work to solidify control.
Should bullish momentum persist, the next target is the $0.00002500 level, with a breakout above this point potentially opening up paths toward $0.00003000. Conversely, if sellers regain influence, buyers may need to defend the $0.00002200 support to sustain the uptrend.
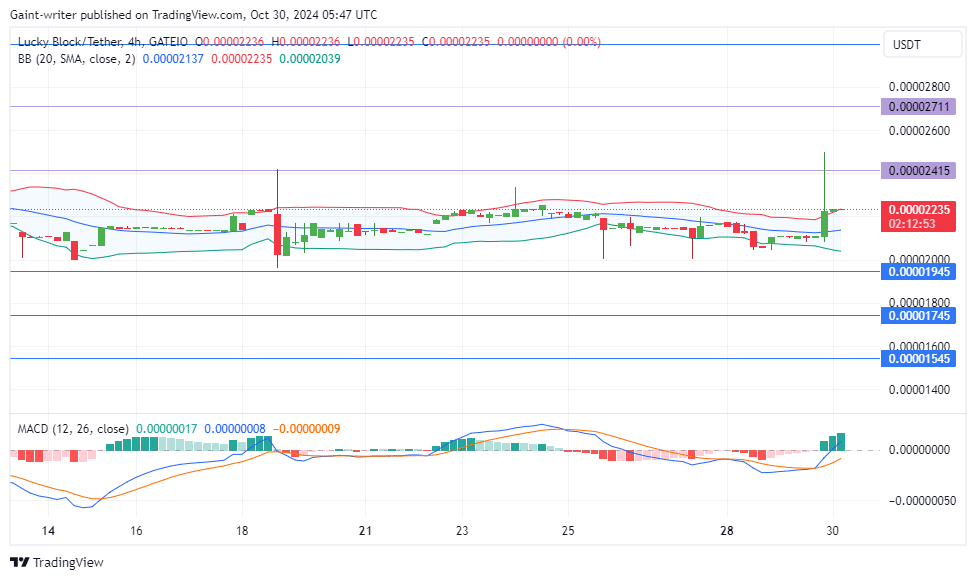
LBLOCKUSD Medium-Term Trend: Bullish (4-Hour Chart)
In the shorter time frame, Lucky Block – Guide, Tips & Insights | Learn 2 Trade buyers show resilience in maintaining upward pressure, signaling potential for continued bullish movement. The Bollinger Band remains relatively quiet, yet buyers’ steady presence hints at imminent expansion.
How To Buy Lucky Block – Guide, Tips & Insights | Learn 2 Trade
Note: Learn2.trade is not a financial advisor. Do your research before investing your funds in any financial asset, product, or event. We are not responsible for your investment results.
- Broker
- Min Deposit
- Score
- Visit Broker
- Award-winning Cryptocurrency trading platform
- $100 minimum deposit,
- FCA & Cysec regulated
- 20% welcome bonus of upto $10,000
- Minimum deposit $100
- Verify your account before the bonus is credited
- Fund Moneta Markets account with a minimum of $250
- Opt in using the form to claim your 50% deposit bonus
Learn to Trade
Never Miss A Trade Again

Signal Notification
Real-time signal notifications whenever a signal is opened, closes or Updated

Get Alerts
Immediate alerts to your email and mobile phone.

Entry Price Levels
Entry price level for every signal Just choose one of our Top Brokers in the list above to get all this free.


