Don’t invest unless you’re prepared to lose all the money you invest. This is a high-risk investment and you are unlikely to be protected if something goes wrong. Take 2 minutes to learn more
Lucky Block – Guide, Tips & Insights | Learn 2 Trade Price Forecast – Expert Analysis & Trading Tips | Learn 2 Trade – Expert Analysis & Trading Tips | Learn 2 Trade – February 26th
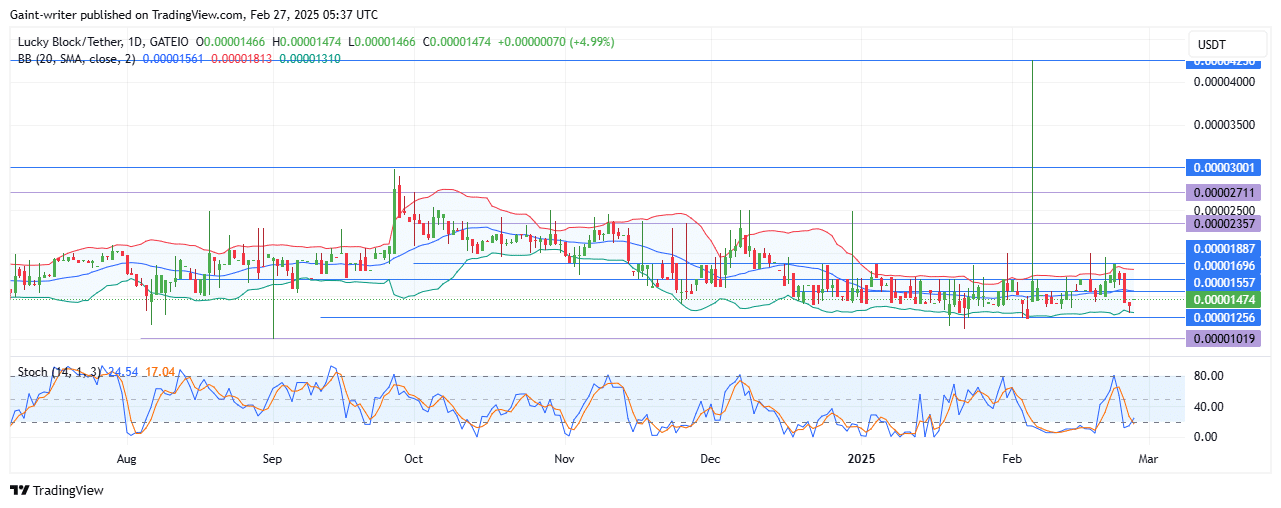
Lucky Block – Guide, Tips & Insights | Learn 2 Trade price forecast shows the price has retraced to the $0.00001250 support level, with buyers looking to initiate a potential upward move.
LBLOCK Key Levels:
Support Levels: $0.00001250, $0.00001000, $0.00001200
Resistance Levels: $0.00001880, $0.00002000, $0.00002300
LBLOCK Long-Term Trend: Bullish (Daily Chart)
February has been a relatively quiet month for Lucky Block – Guide, Tips & Insights | Learn 2 Trade, with price action constrained within a consolidation range. Buyers have made several attempts to breach the $0.00001880 key area but remain pressured by sellers.
Lucky Block – Guide, Tips & Insights | Learn 2 Trade Price Forecast – Expert Analysis & Trading Tips | Learn 2 Trade – Expert Analysis & Trading Tips | Learn 2 Trade – LBLOCKUSD Outlook
The Bollinger Band indicator remains compressed, suggesting that a breakout could be imminent.The RSI (Relative Strength Index) signals buyers gaining strength, hinting at a possible upside move.
A breakout above $0.00001880 could confirm a strong bullish continuation, while failure to do so may keep LBLOCK in a sideways structure. Traders should monitor the Bollinger Band expansion, as it will indicate the direction of the next major price move
With buyers sustaining pressure, LBLOCKUSD could break through $0.00001880, potentially targeting the the $0.00002000 key level and beyond. If the market remains indecisive, the price may range between $0.00001250 and $0.00001880 key area before a decisive move occurs.
 Lucky Block – Guide, Tips & Insights | Learn 2 Trade Medium-Term Trend: (4-Hour Chart)
 Lucky Block – Guide, Tips & Insights | Learn 2 Trade Medium-Term Trend: (4-Hour Chart)
On the 4-hour chart, buyers are building momentum, with the RSI hovering near the mid-level, suggesting a potential breakout attempt.
The Bollinger Band indicator shows tight price movement, signaling a build-up for volatility. The RSI remains neutral, indicating that buy traders need to exert more pressure to confirm bullish dominance.
How To Buy Lucky Block – Guide, Tips & Insights | Learn 2 Trade
Note: Learn2.trade is not a financial advisor. Do your research before investing your funds in any financial asset, product, or event. We are not responsible for your investment results.
- Broker
- Min Deposit
- Score
- Visit Broker

- Award-winning Cryptocurrency trading platform
- $100 minimum deposit,
- FCA & Cysec regulated

- 20% welcome bonus of upto $10,000
- Minimum deposit $100
- Verify your account before the bonus is credited
- Fund Moneta Markets account with a minimum of $250
- Opt in using the form to claim your 50% deposit bonus
Learn to Trade
Never Miss A Trade Again

Signal Notification
Real-time signal notifications whenever a signal is opened, closes or Updated

Get Alerts
Immediate alerts to your email and mobile phone.

Entry Price Levels
Entry price level for every signal Just choose one of our Top Brokers in the list above to get all this free.