Don’t invest unless you’re prepared to lose all the money you invest. This is a high-risk investment and you are unlikely to be protected if something goes wrong. Take 2 minutes to learn more
Lucky Block – Guide, Tips & Insights | Learn 2 Trade price forecast shows the market is making a notable comeback as it approaches the $0.00001250 key area.
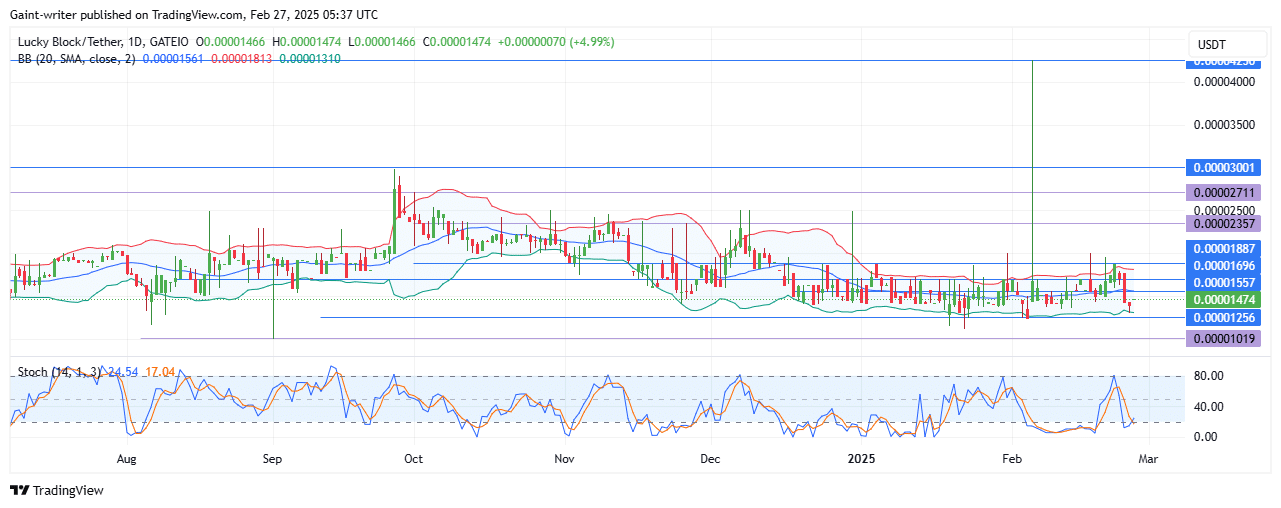
LBLOCK Key Levels
Support Levels: $0.00001250, $0.00001000 Resistance Levels: $0.00001880, $0.00002000
The price has been consolidating around the $0.00001250 area, indicating a potential breakout is on the horizon. Last week, bullish efforts were visible as the price reached up to the $0.00001880 key area. This week has seen a return to consolidation as sellers attempt to establish a foothold.
LBLOCKUSD Price Forecast – Market Outlook
The Bollinger Band indicator suggests that while the market is currently in a consolidation phase, it may soon provide the opportunity for expansion. Traders should be prepared for a potential price turnover from the $0.00001250 significant zone as buyers aim to seize control.
The Stochastic Oscillator reflects a crossover signal, indicating that buyers are eager to take charge. This technical signal aligns with the overall sentiment that the bulls are ready to push higher. On the long time frame, buyers have been building consistency for several weeks, although the current price action has remained within a tight range.
Despite the quieter phase indicated by the Bollinger Band, Lucky Block – Guide, Tips & Insights | Learn 2 Trade appears poised for a bullish breakout. The Stochastic Oscillator suggests an increasing potential for upward movement in the market. This reinforces the idea that buyers may soon gain the upper hand.
LBLOCKUSD Medium Term Trend: Bullish (4-hour chart)
As Lucky Block – Guide, Tips & Insights | Learn 2 Trade continues to trade within a close range, market participants should watch for signs of expansion. If buyers can effectively navigate the consolidation phase and push beyond the recent highs, targets around the $0.00002000 resistance level may come into play.
The determination of buyers to push higher shows bullish intentions and suggests that the market may be on the cusp of a significant move.
Note: Learn2.trade is not a financial advisor. Do your research before investing your funds in any financial asset, product, or event. We are not responsible for your investment results.
Trade on MT4 with Leverage up to 1:500! Trade on MT4 with Leverage up to 1:500!
X
We use cookies to ensure that we give you the best experience on our website. If you continue to use this site we will assume that you are happy with it.

 LBLOCKUSD Medium Term Trend: Bullish (4-hour chart)
 LBLOCKUSD Medium Term Trend: Bullish (4-hour chart)


