Don’t invest unless you’re prepared to lose all the money you invest. This is a high-risk investment and you are unlikely to be protected if something goes wrong. Take 2 minutes to learn more
Lucky Block Price Forecast – December 1, 2025
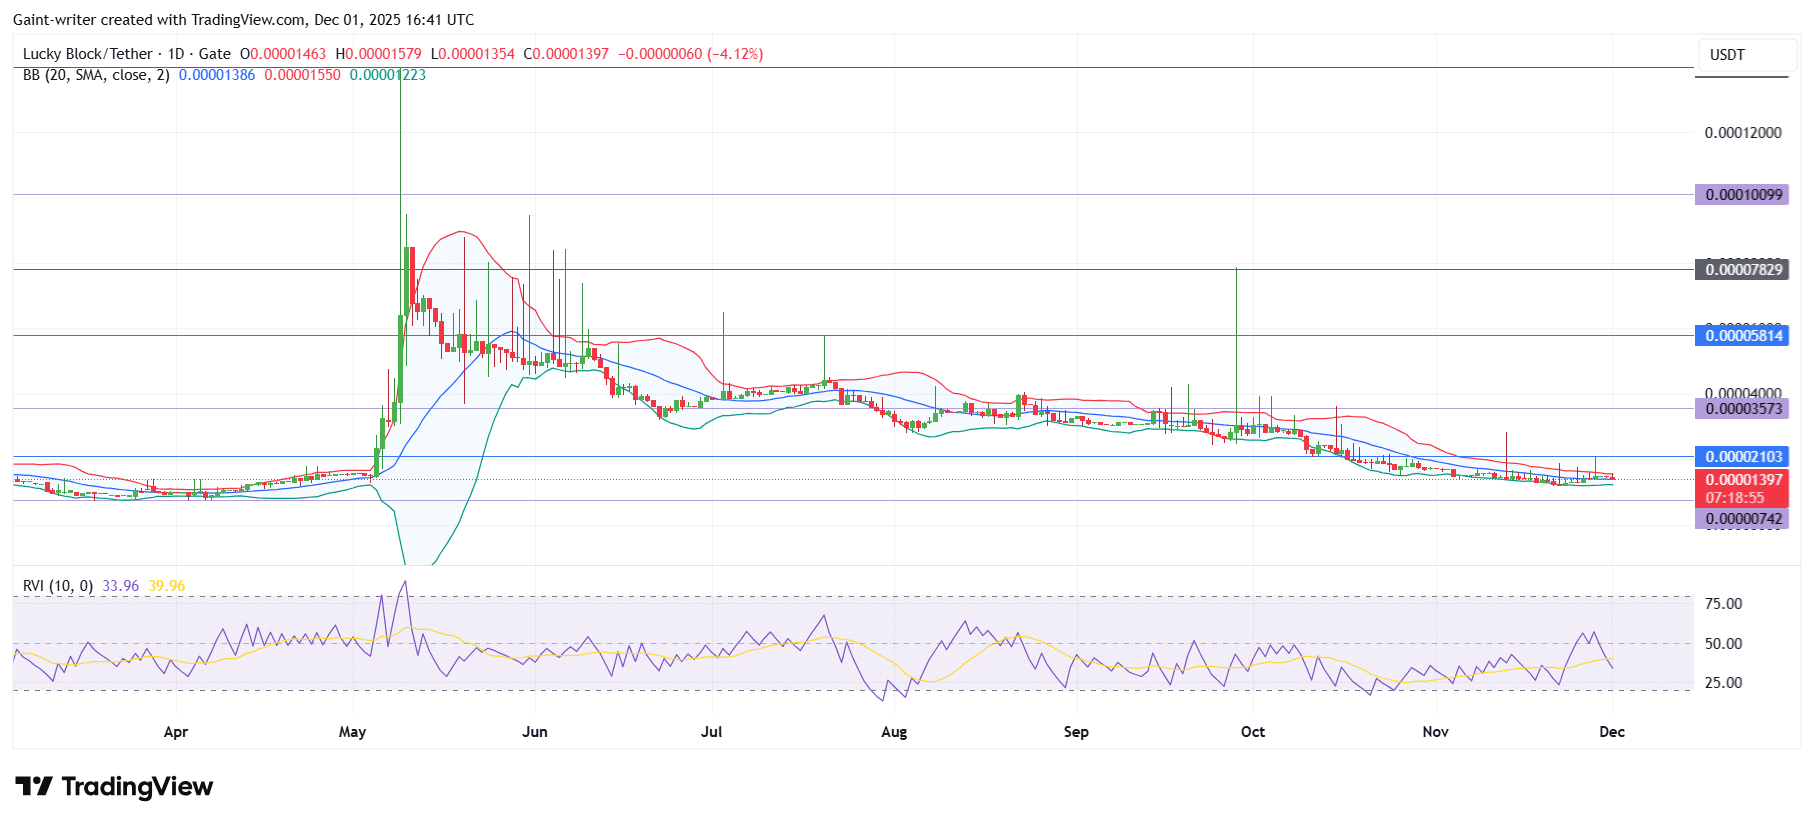
Lucky Block price forecast is currently trading around $0.000014, showing stability after a month-long decline.
LBlock Daily Key Levels:
Support Levels: 0.000013, 0.000010 Resistance Levels: 0.000015, 0.000017
Despite the bearish structure since early November, buyers are aggressively defending short-term lows, keeping price action stable. Market sentiment is neutral, with traders awaiting a high-volume breakout from the current tight consolidation range.
Lucky Block Price Forecast- LBLOCKUSDT Outlook
Lucky Block remains confined within a descending channel that began in October, confirming the prevailing bearish trend. Price is now trading near the lower boundary of this channel, which has acted as a crucial demand zone.
The current level around 0.000014 represents the 30-day low. The ability of buyers to defend this area highlights seller exhaustion and accumulation at the base. The MACD line remains below the Signal line, with red histogram bars confirming lingering bearish momentum. However, the flattening structure suggests that downside pressure is weakening, and the market is preparing for a potential reversal once momentum shifts.
The MACD remains the key indicator to watch. Its compressed lines and fading histogram bars suggest that bearish momentum is losing strength. A bullish crossover would confirm the start of recovery. Market volume is extremely low, with price locked between 0.000013 and 0.000015. This tight consolidation reflects accumulation and energy building for the next move.
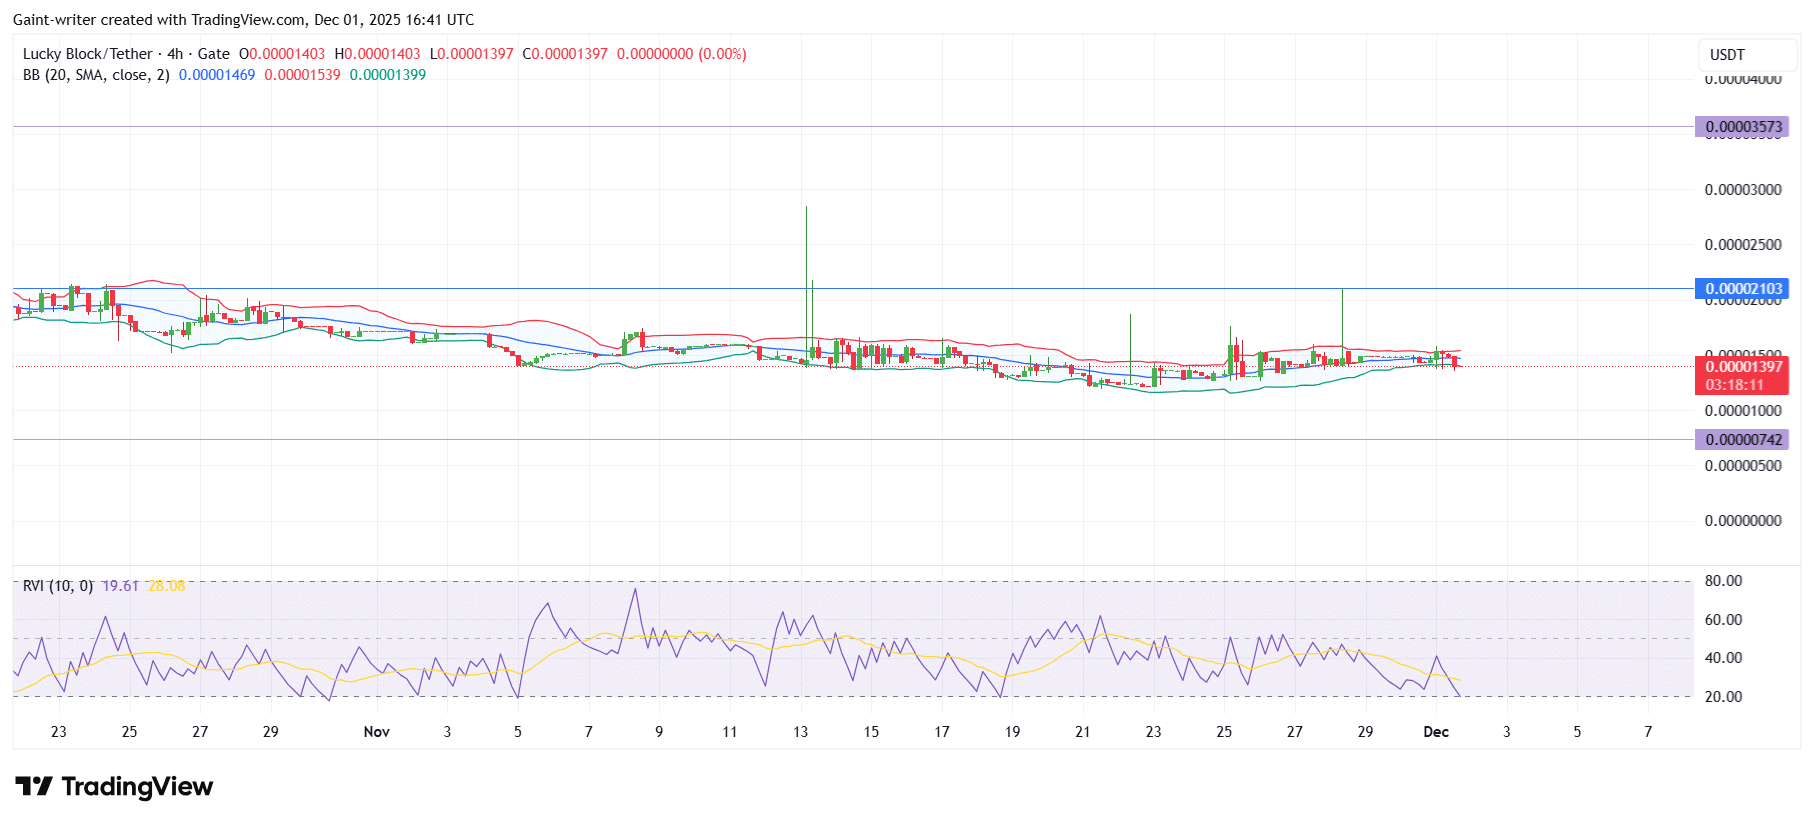
Lucky Block Short Term Trend – Bullish (4 Hour Chart)
On the 4-hour chart, LBLOCK is consolidating in a narrow horizontal range between 0.000013 and 0.000015. This structure reflects indecision but also accumulation, as sellers appear exhausted.
The MACD lines are compressed near the zero line, while the histogram fluctuates between tiny red and green bars. This flat reading signals a complete loss of directional momentum, reinforcing the consolidation phase.
Note: Learn2.trade is not a financial advisor. Do your research before investing your funds in any financial asset, product, or event. We are not responsible for your investment results
Trade on MT4 with Leverage up to 1:500! Trade on MT4 with Leverage up to 1:500!
X
We use cookies to ensure that we give you the best experience on our website. If you continue to use this site we will assume that you are happy with it.