Lucky Block – Guide, Tips & Insights | Learn 2 Trade Price Forecast – Expert Analysis & Trading Tips | Learn 2 Trade – Expert Analysis & Trading Tips | Learn 2 Trade: September 14
The Lucky Block – Guide, Tips & Insights | Learn 2 Trade price forecast is for the market to break to the upside of the current triangle pattern in which it is consolidating.
LBLOCK/USD Long-Term Trend: Bullish (30-Minute Chart)
Key Levels:
Zones of supply: $0.000940, $0.000810, $0.000750
Zones of Demand: $0.000670, $0.000630, $0.000500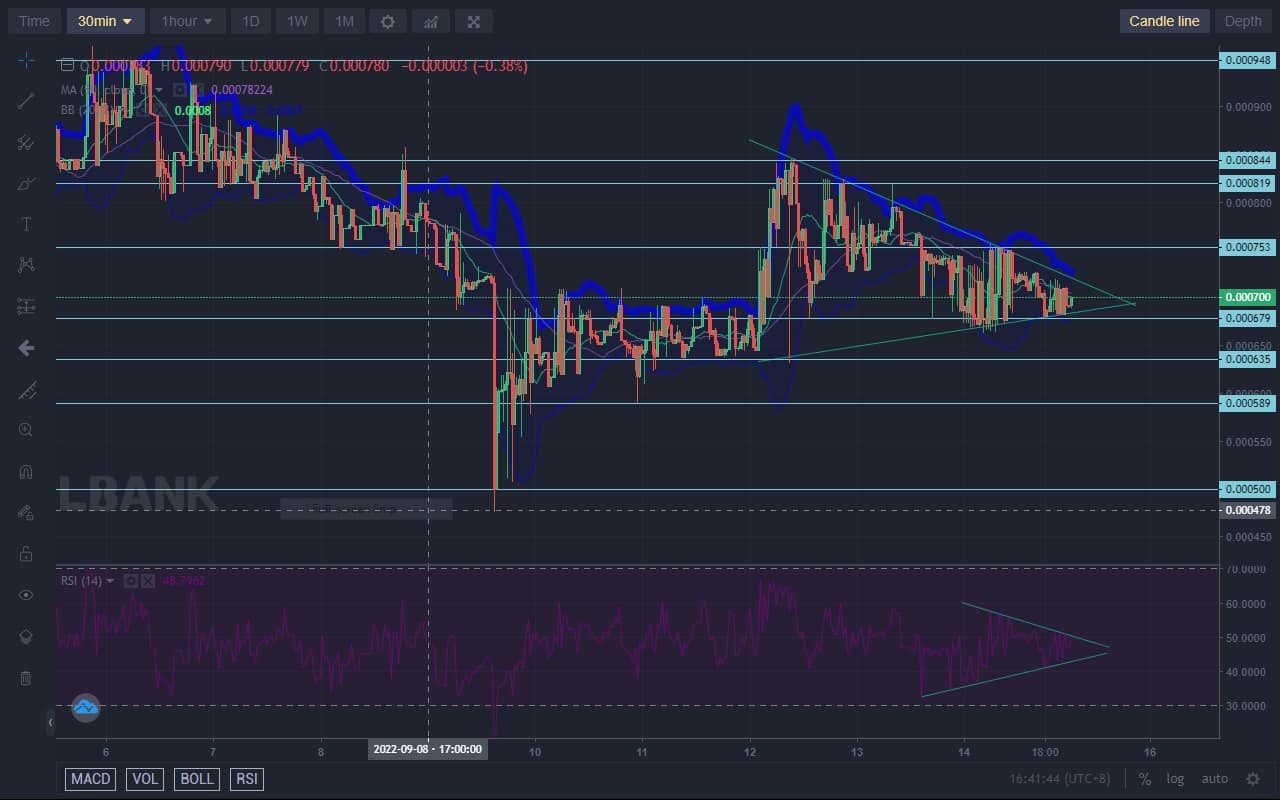
Lucky Block – Guide, Tips & Insights | Learn 2 Trade Price Forecast – Expert Analysis & Trading Tips | Learn 2 Trade – Expert Analysis & Trading Tips | Learn 2 Trade: LBLOCK/USD Outlook
The buyers are slowly reclaiming the market. This started when the price dropped to $0.000500. The buyers had become energized, so they pushed hard at the resistance level of $0.000670.
The $0.000670 level eventually gave way to becoming a support for the market, which rose above it. Lucky Block – Guide, Tips & Insights | Learn 2 Trade is now attempting to break through the next major barrier at $0.000810.
The market has reverted to consolidating in a triangle formation. As a result, the Bollinger Bands are squeezing against the candles. It can be noticed that the RSI (Relative Strength Index) line is tapering into a triangle. The market’s rise is imminent.
LBLOCK/USD Medium-Term Trend: Bullish (5-minute chart)
On the 5-minute chart, there is much agitation in the market as the price tapers more and more into the triangle pattern. The coin is about to get to the tip of the triangle, and as this continues, the Bollinger Bands keep squeezing into the market. A break out is thus imminent.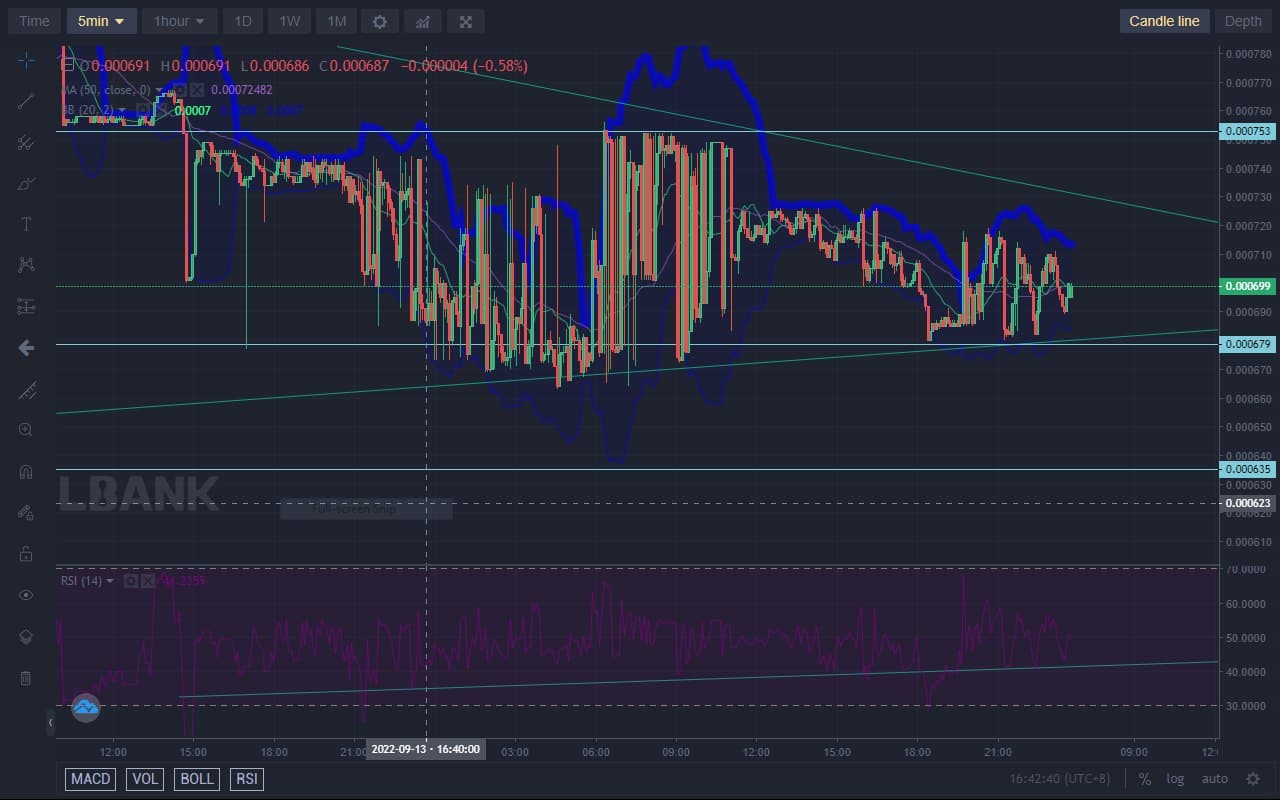
How To Buy Lucky Block – Guide, Tips & Insights | Learn 2 Trade
Note: Learn2.trade is not a financial advisor. Do your research before investing your funds in any financial asset or presented product or event. We are not responsible for your investing results.
- Broker
- Min Deposit
- Score
- Visit Broker

- Award-winning Cryptocurrency trading platform
- $100 minimum deposit,
- FCA & Cysec regulated

- 20% welcome bonus of upto $10,000
- Minimum deposit $100
- Verify your account before the bonus is credited
- Fund Moneta Markets account with a minimum of $250
- Opt in using the form to claim your 50% deposit bonus
Learn to Trade
Never Miss A Trade Again

Signal Notification
Real-time signal notifications whenever a signal is opened, closes or Updated

Get Alerts
Immediate alerts to your email and mobile phone.

Entry Price Levels
Entry price level for every signal Just choose one of our Top Brokers in the list above to get all this free.