

Lucky Block Price Forecast – Expert Analysis & Trading Tips | Learn 2 Trade – Expert Analysis & Trading Tips | Learn 2 Trade – September 13
The Lucky Block price forecast is for the market to rebound from the $0.000680 support level and break the $0.000830 resistance level.
LBLOCK/USD Long-Term Trend: Bullish (30-Minute Chart)
Key Levels:
Zones of supply: $0.000740, $0.000830
Zones of Demand: $0.000470, $0.000680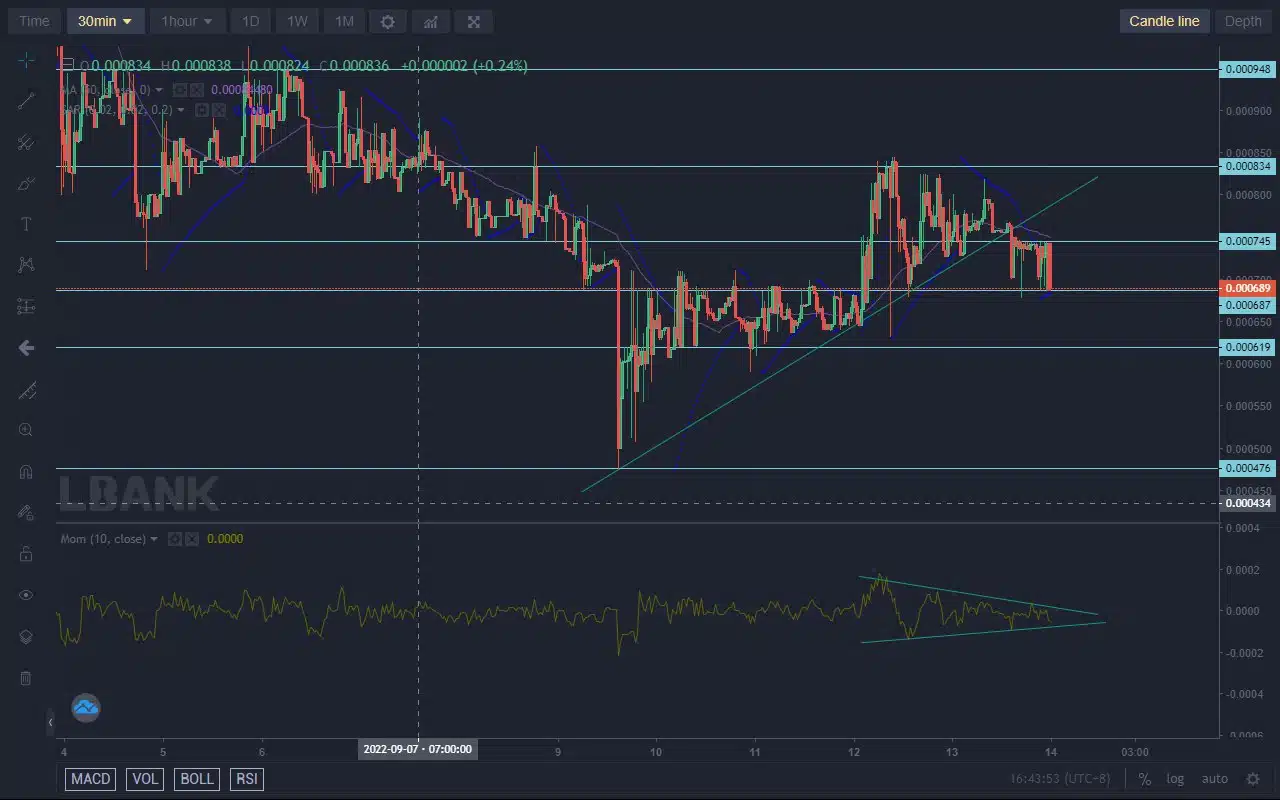
Lucky Block Price Forecast – Expert Analysis & Trading Tips | Learn 2 Trade – Expert Analysis & Trading Tips | Learn 2 Trade: LBLOCK/USD Outlook
The bearish trend in the market has been redirected in an upward direction on the 9th of September from the $0.000470 significant support level. In doing so, the price breaks the $0.000680 barrier.
The coin kept sliding upward along its trendline, but forceful resistance from a new level at $0.000830 ensures that the market falls off the trendline. Buyers still have the upper hand and will look to spring back immediately from the $0.000680 support.
A string of Parabolic SAR (Stop and Reverse) dots appear above the 30 min candles to show the rejection suffered. However, as the candles touch down at $0.000680, a new string of dots begins to line up below the candlesticks.
LBLOCK/USD Medium-Term Trend: Bullish (5-minute chart)
Also on the 30-minute chart, the Momentum indicator line is being compressed into a triangle shape showing consolidation. This is expected to lead to a breakout to the upside. The 5-minute Momentum indicator also confirms the same setup.
How To Buy Lucky Block
Note: Learn2.trade is not a financial advisor. Do your research before investing your funds in any financial asset or presented product or event. We are not responsible for your investing results.


