Key Highlights
LTC price is in a confined range
The altcoin’s price remain stagnant
Litecoin (LTC) Current Statistics
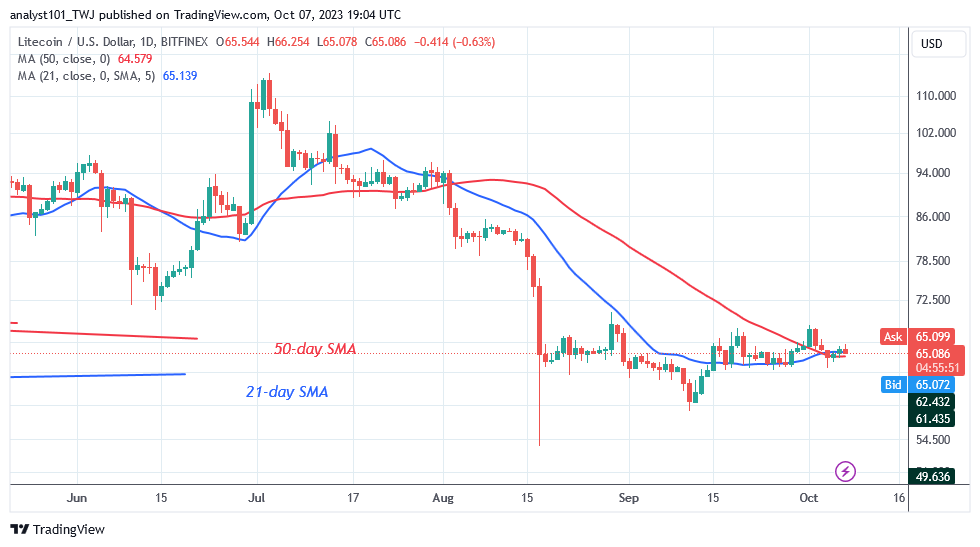
The current price: $65.30
Market Capitalization: $5,485,079,051
Trading Volume: $152,071,410
Major supply zones: $80, $100, $120
Major demand zones: $60, $40, $20
Litecoin (LTC) Price Analysis October 7, 2023
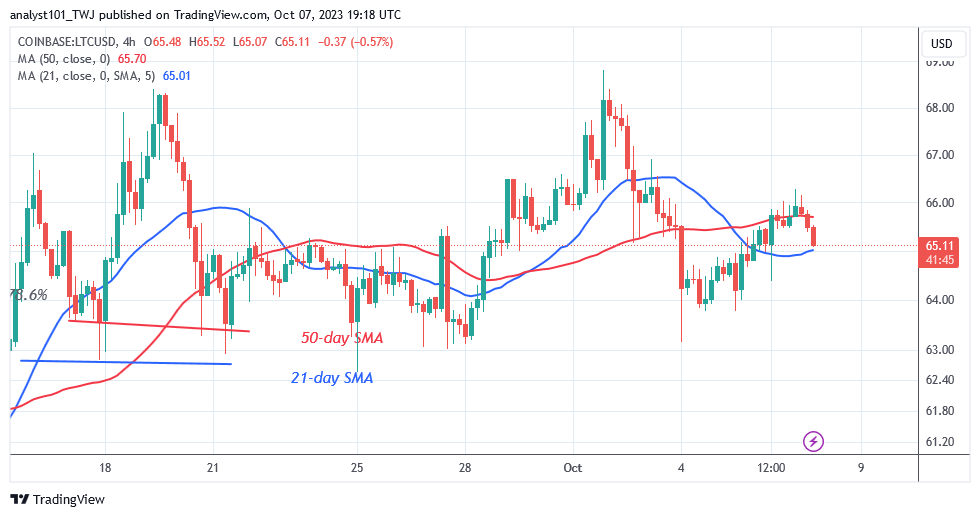
Litecoin (LTC) is once again trading in the range between $ 61 and $68 as it meets rejection at $66. The resistance level of $68 has been tried and broken three times by the price of the cryptocurrency. The bullish momentum could not be sustained. The altcoin was repulsed on October 2 when it fell above the moving average lines.
Litecoin is now selling at $65 as of this writing. The range bound thresholds have not been broken since August 17. Each side has been defending its current levels.Doji candlesticks have caused the price movement to remain unchanged. The Doji candlesticks’ restriction on the altcoin prevented it from recovering.
Analysts anticipate that Litecoin will rise to a high of $88, if the current resistance is overcome.The price of the cryptocurrency has since ceased.
Litecoin (LTC) Technical Indicators Reading
The price bars are above the moving average lines, suggesting that the cryptocurrency may rise. The horizontal flatness of the moving average lines indicates a sideways tendency. Additionally, it shows that the decline is over.
Conclusion
Since August 17, Litecoin has been on a sideways trend as it meets rejection at $66. The Doji candlesticks have been in control of price movement for the past two months. These candlesticks stand in for investors. The candlesticks show that both buyers and sellers are unsure of the market’s direction.
LTC/USD will maintain its narrow range throughout its trading range.
You can purchase crypto coins here: Buy LBLOCK
NOTE: Learn2.Trade is not a financial advisor. Do your research before investing your funds in any financial asset or presented product or event. We are not responsible for your investing results
- Broker
- Min Deposit
- Score
- Visit Broker

- Award-winning Cryptocurrency trading platform
- $100 minimum deposit,
- FCA & Cysec regulated

- 20% welcome bonus of upto $10,000
- Minimum deposit $100
- Verify your account before the bonus is credited
- Fund Moneta Markets account with a minimum of $250
- Opt in using the form to claim your 50% deposit bonus
Learn to Trade
Never Miss A Trade Again

Signal Notification
Real-time signal notifications whenever a signal is opened, closes or Updated

Get Alerts
Immediate alerts to your email and mobile phone.

Entry Price Levels
Entry price level for every signal Just choose one of our Top Brokers in the list above to get all this free.