Key Highlights
The crypto now fluctuates between $80 and $84
A possible retest of the overhead is likely
Litecoin (LTC) Current Statistics
The current price: $81.33
Market Capitalization: $5,384,495,588
Trading Volume: $3,781,505,673
Major supply zones: $70, $80, $90
Major demand zones: $50, $30, $10
Litecoin (LTC) Price Analysis December 15, 2020
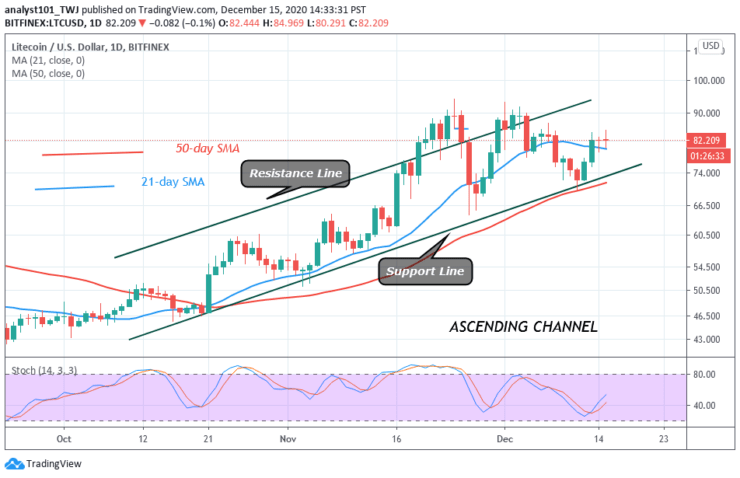
Litecoin is trading at $82 as it attempts to retest the $90 overhead resistance. The bulls have failed to break the resistance since November 24. The bears have pushed the price below $86. Since December 13, the coin has been fluctuating to retest the $84 to $86 and $90 overhead resistance. The current price range is close to overhead resistance. This close range will provide the necessary price movement in the event of a breakout.
Litecoin (LTC) Technical Indicators Reading
The altcoin is above the 40% range of the daily stochastic. It indicates that the coin is in a bullish momentum. The 21-day SMA and the 50-day SMA are sloping upward indicating the main trend. The price bars above the SMAs suggest an upward move of the coin.
Conclusion
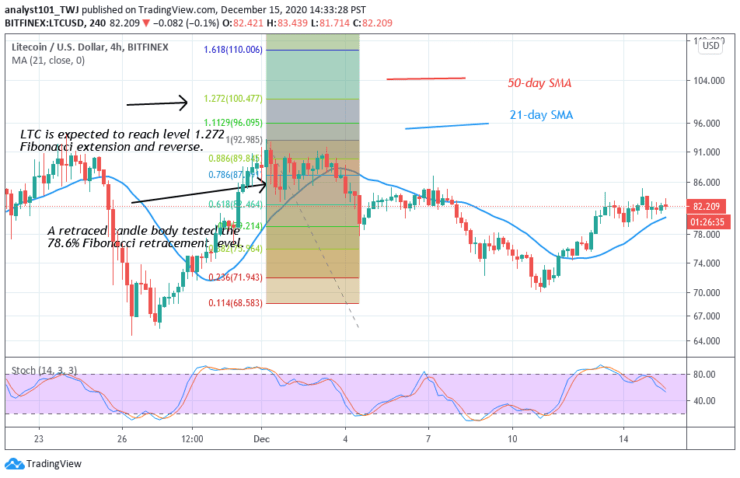
The bears are strongly defending the $90 overhead resistance. According to the Fibonacci tool, there is the possibility of a further upward move. On December 1, a retraced candle body tested the 78.6%Fibonacci retracement level. The retracement indicates that the crypto will reach level 1.272 Fibonacci extensions or the high of $100.57. Litecoin is likely to reverse thereafter.
Note: Learn2.Trade is not a financial advisor. Do your research before investing your funds in any financial asset or presented product or event. We are not responsible for your investing results
- Broker
- Min Deposit
- Score
- Visit Broker

- Award-winning Cryptocurrency trading platform
- $100 minimum deposit,
- FCA & Cysec regulated

- 20% welcome bonus of upto $10,000
- Minimum deposit $100
- Verify your account before the bonus is credited
- Fund Moneta Markets account with a minimum of $250
- Opt in using the form to claim your 50% deposit bonus
Learn to Trade
Never Miss A Trade Again

Signal Notification
Real-time signal notifications whenever a signal is opened, closes or Updated

Get Alerts
Immediate alerts to your email and mobile phone.

Entry Price Levels
Entry price level for every signal Just choose one of our Top Brokers in the list above to get all this free.