Litecoin (LTC) Price Analysis: Daily Chart – Bearish
Key resistance levels: $40, $42, $45
Key support levels: $35, $33, $31
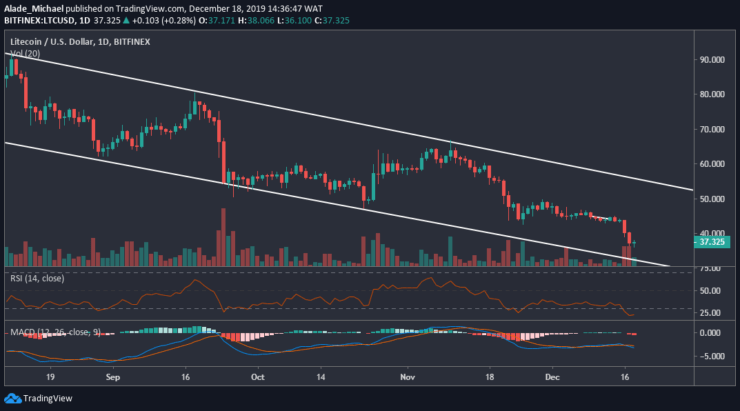
The daily chart for Litecoin shows that the market continues to aim the channel’s lower boundary, though the bearish scenario is likely to end soon. Meanwhile, there’s still a room for a more southward move as $35, $33 and $31support may be explored in the next few days. Taking a look at the RSI indicator, we can see that the market has entered the oversold region, which means the current price of is undervalued.

Additionally, the MACD signalled a negative price action as momentum turns sideways. This means that the LTC market is indecisive at the moment. If the buyers show commitment, we may see a small buying pressure to $40 resistance. A continuous increase could allow us to test $42 and $45 resistance again. As of now, the bears are currently dominating the market.
Litecoin (LTC) Price Analysis: 30M Chart – Bearish
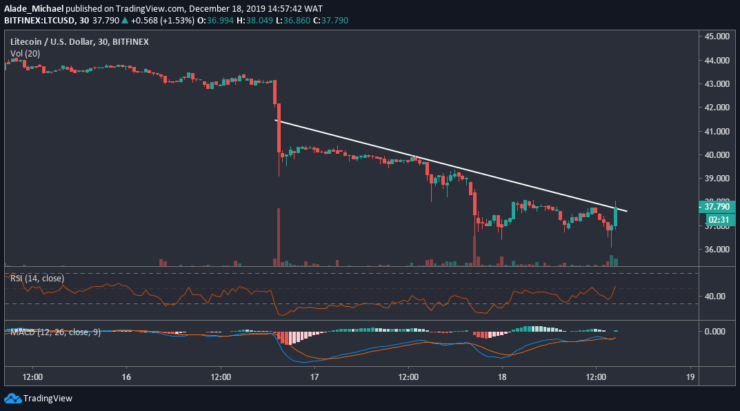
Litecoin is still trending bearishly on the 30-minutes time frame. But looking at the recent rejection at $36, the bulls are likely to step back into the market. We can see that Litecoin is brewing for a bullish surge. The white descending line seems to be suppressing the buying pressure. A successful climb could walk the buyers to $39, followed by $41 and $43 resistance.

Interestingly, the technical indicators are gaining recovery to the positive zone, though the MACD and RSI are yet to provide a crossover for bullish confirmation. In the opposite direction, Litecoin may keep rolling downward if the price action continues to respect the descending trend line. If such a scenario occurs, LTC may drop back to $36 and $35 support. The bearish trend would remain valid until buyers take control of the market.
LITECOIN BUY SIGNAL
Buy Entry: $37.7
TP: $40 / $42
SL: 35.9
- Broker
- Min Deposit
- Score
- Visit Broker
- Award-winning Cryptocurrency trading platform
- $100 minimum deposit,
- FCA & Cysec regulated
- 20% welcome bonus of upto $10,000
- Minimum deposit $100
- Verify your account before the bonus is credited
- Fund Moneta Markets account with a minimum of $250
- Opt in using the form to claim your 50% deposit bonus
Learn to Trade
Never Miss A Trade Again

Signal Notification
Real-time signal notifications whenever a signal is opened, closes or Updated

Get Alerts
Immediate alerts to your email and mobile phone.

Entry Price Levels
Entry price level for every signal Just choose one of our Top Brokers in the list above to get all this free.


