Key Highlights
Litecoin reaches the high of $174 but was resisted
The alt-coin plunges to $164 low
Litecoin (LTC) Current Statistics
The current price: $168.35
Market Capitalization: $14,105,166,061
Trading Volume: $9,936,084,311
Major supply zones: $200, $220, $240
Major demand zones: $100, $80, $60
Litecoin (LTC) Price Analysis February 9, 2021
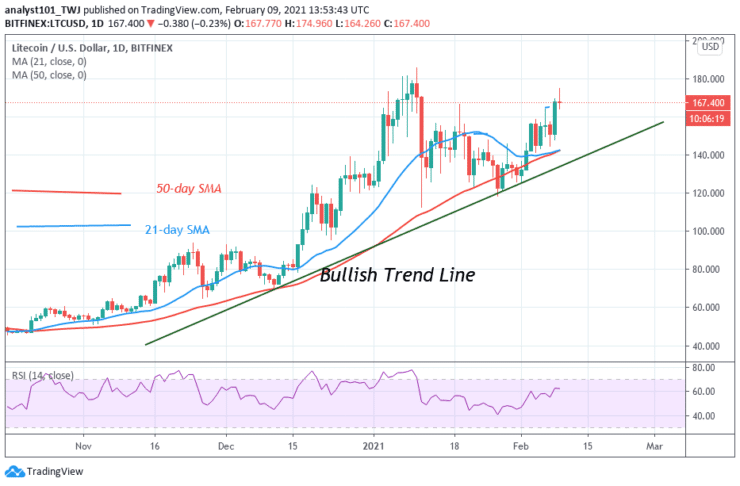
On February 8, Litecoin rebounded above $151 support and rallied above the $160 resistance. The bullish momentum reached the high of $175 and was resisted. LTC would have reached the high of $200 if the bulls clear the minor resistance at $175. Consequently, LTC is retracing to the downside. It is likely the selling pressure will subside at the low of $164. The market will resume upward if the $164 support holds. Today, LTC has resumed upward move and it is trading at $167 at the time of writing.
Litecoin (LTC) Technical Indicators Reading
The 50-day and 21-day SMAs are sloping upward indicating an uptrend. The price bars have continued to remain above the SMAs which indicate the upward movement of the coin. Litecoin has risen to level 62 of the Relative Strength Index period 14. It indicates that the altcoin is in the uptrend zone and approaching the overbought region.
Conclusion
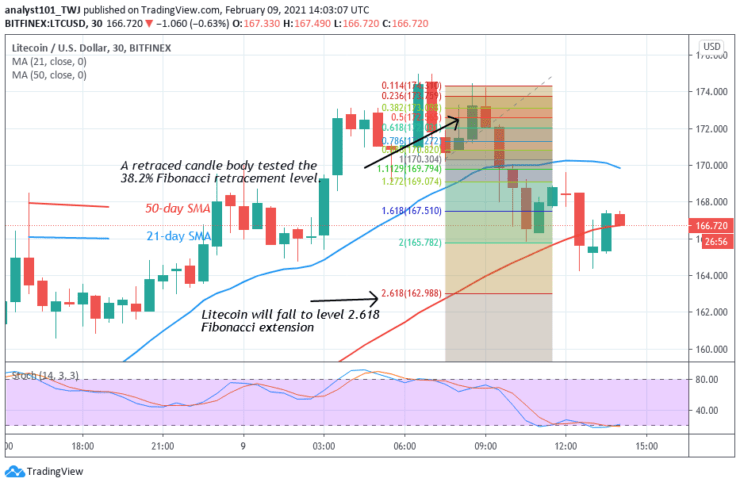
Litecoin is in a downward move. The downtrend has reached bearish exhaustion. On February 9 downtrend; a retraced candle body tested the 38.2% Fibonacci retracement level. The retracement indicates that the crypto will reach level 2.618 Fibonacci extensions or the low of $162.98.
Note: Learn2.Trade is not a financial advisor. Do your research before investing your funds in any financial asset or presented product or event. We are not responsible for your investing results
- Broker
- Min Deposit
- Score
- Visit Broker

- Award-winning Cryptocurrency trading platform
- $100 minimum deposit,
- FCA & Cysec regulated

- 20% welcome bonus of upto $10,000
- Minimum deposit $100
- Verify your account before the bonus is credited
- Fund Moneta Markets account with a minimum of $250
- Opt in using the form to claim your 50% deposit bonus
Learn to Trade
Never Miss A Trade Again

Signal Notification
Real-time signal notifications whenever a signal is opened, closes or Updated

Get Alerts
Immediate alerts to your email and mobile phone.

Entry Price Levels
Entry price level for every signal Just choose one of our Top Brokers in the list above to get all this free.