Key Support Levels: $50, $30, $10
LTC/USD Price Long-term Trend: Bullish
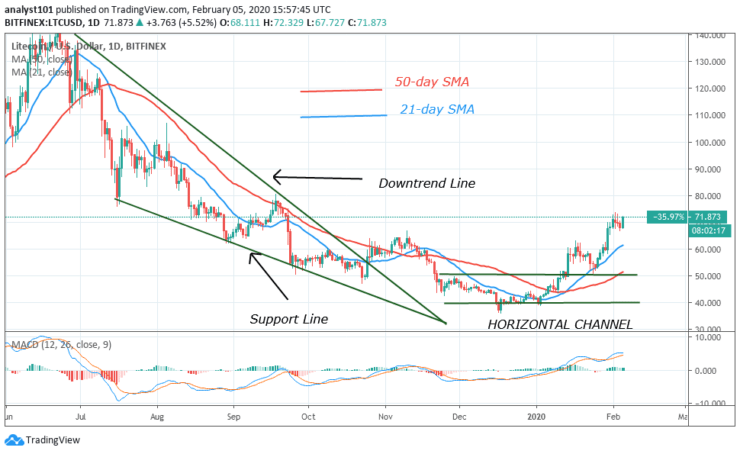
Since February 1, the bulls have continued to bombard the resistance at $72. Unfortunately, the bulls have made two unsuccessful attempts but are unrelenting. A third attempt is also made at the resistance. A successful break at the resistance of $72 will propel the coin above the $80 price level. That is not the end.
There is a probability of the momentum extending to the $96 price level. Nonetheless, if the bulls are successful above $80, Litecoin is said to be out of the downtrend zone. On the other hand, if the resistance remains unbroken, Litecoin will continue its fluctuations below the resistance level. Alternatively, the bears may break the low of $68, and the coin will drop to the low of $60.
Daily Chart Indicators Reading:
According to MACD, Litecoin is still in an uptrend. Litecoin will continue its upward move as long as the MACD line and the signal line are above the zero lins which gives a buy signal. Secondly, the price bars must be above the 21-day and 50-day SMAs. Thirdly, the EMAs have formed a bullish crossover indicating that the upward move is ongoing.
LTC/USD Medium-term bias: Bullish
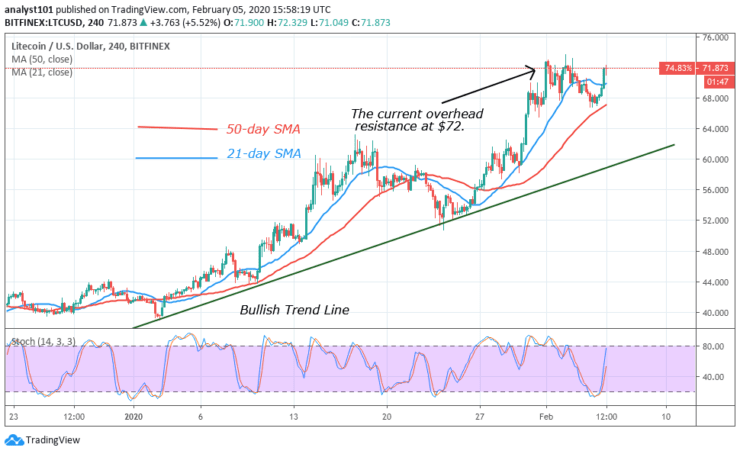
On the 4 hour chart, the coin is in an uptrend. The bulls encountered resistance at the $60 and $62 price levels. The resistance made the coin to fall to the low of $52 or the support level of the trend line. The coin bounced and the price reached a high of $72 and pulled back. The bulls are engaged in the price tussle at the overhead resistance.
4-hour Chart Indicators Reading
The bulls have reached the resistance at $72 and the coin is falling again. The stochastic also rose and it is approaching the overbought region of the market. When the stochastic reaches the overbought region, it indicates that the buyers are no longer on hand to push the LTC upward. Therefore, LTC may fall in the presence of sellers.
General Outlook for LTC
Litecoin has the prospect of rising as the coin is in the bullish trend zone. Unfortunately, the knotty resistance at $72 is yet to be broken. The bulls have now made three failed attempts at the resistance to break it. At the moment, the coin is fluctuating in a tight range between $68 and $72. A break above $72 will propel the coin to go up higher. Similarly, a break of below $68 will push the coin downward.
LTC Trade Signal
Instrument: LTC/USD
Order: Buy
Entry price: $71
Stop: $68
Target: $80
Note: Learn2Trade.com is not a financial advisor. Do your research before investing your funds in any financial asset or presented product or event. We are not responsible for your investing results
- Broker
- Min Deposit
- Score
- Visit Broker

- Award-winning Cryptocurrency trading platform
- $100 minimum deposit,
- FCA & Cysec regulated

- 20% welcome bonus of upto $10,000
- Minimum deposit $100
- Verify your account before the bonus is credited
- Fund Moneta Markets account with a minimum of $250
- Opt in using the form to claim your 50% deposit bonus
Learn to Trade
Never Miss A Trade Again

Signal Notification
Real-time signal notifications whenever a signal is opened, closes or Updated

Get Alerts
Immediate alerts to your email and mobile phone.

Entry Price Levels
Entry price level for every signal Just choose one of our Top Brokers in the list above to get all this free.