• The sideways trend may resume if Bitcoin climbs well above $9200.
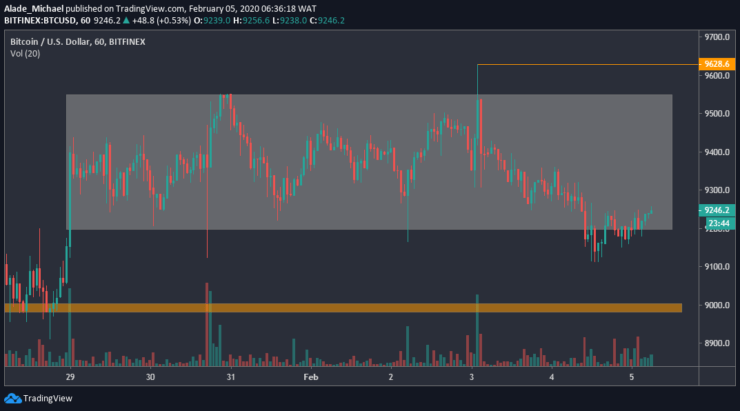
After touching $9628 this week, Bitcoin saw a substantial price reduction with a slight break to around $9100 yesterday. This price area has provided a small rebound as Bitcoin climbs back above $9200 which held bearish pressure for days. If the price continues to increase, Bitcoin may gain momentum back to $9600 soon.
Key resistance levels: $9400, $9600
Key support levels: $9100, $9000
Bitcoin (BTC) Price Analysis: Hourly Chart – Bearish
Over the last 24-hours, Bitcoin has remained on a downward range but now preparing for an upward movement. BTC recently found support around the $9100 area after dropping beneath the white box. As of now, Bitcoin is showing a sign of recovery as price actions resume in this white area. If BTC resume trading in this area, the market may continue to keep a sideways trend.

Nonetheless, we might need to keep an eye on $94000 and $9600 resistance on the upside. Meanwhile, the $9628 is a bullish breakout for Bitcoin. In the opposite direction, the price may continue to drop if the sellers resume pressure in the market. In such case, we may need to consider key support at $9100 and $9000 – where the orange support area lies. A drive beneath this area could trigger more selling pressure.
Bitcoin (BTC) Price Analysis: 15M Chart – Bearish
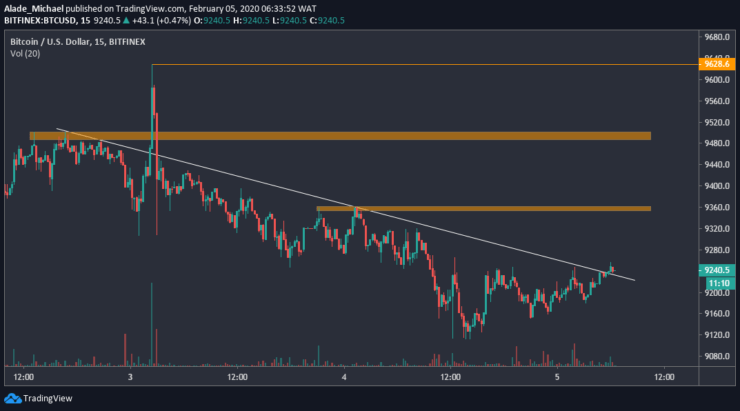
For some days now, Bitcoin is following a bearish sentiment on the 15-minute time frame. Following the scenario, Bitcoin has managed to establish support at the $9100 as the price bounced back. Apart from reaching the regression line, Bitcoin has seen a slight break-up, suggesting a potential price increase.

If the break becomes significant, Bitcoin would target the orange horizontal resistance area of $9360 and $9500 in the coming hours. Further growth could project BTC at $9628 – a breakout level for buyers. However, a false break may turn the market back in the hands of the bears. In case of a bearish extension, BTC could slip back to $9100 support and below.
BITCOIN BUY ORDER
Buy: $9245
TP: $9475
SL: $9080
- Broker
- Min Deposit
- Score
- Visit Broker
- Award-winning Cryptocurrency trading platform
- $100 minimum deposit,
- FCA & Cysec regulated
- 20% welcome bonus of upto $10,000
- Minimum deposit $100
- Verify your account before the bonus is credited
- Fund Moneta Markets account with a minimum of $250
- Opt in using the form to claim your 50% deposit bonus
Learn to Trade
Never Miss A Trade Again

Signal Notification
Real-time signal notifications whenever a signal is opened, closes or Updated

Get Alerts
Immediate alerts to your email and mobile phone.

Entry Price Levels
Entry price level for every signal Just choose one of our Top Brokers in the list above to get all this free.


