BNBUSD Price Analysis – April 01
The price has increased to the $448 level and when the daily candle closes above it, the price may increase to $516, and may expose the price to the $581 resistance level. In case there is an opposition by the bears at the resistance level of $448, the price may decrease towards the support levels of $382, $329 and $256
BNB/USD Market
Key levels:
Supply levels: $448, $516, $581
Demand levels: $398, $329, $256
BNBUSD Long-term Trend: Bullish
BNBUSD is on the bullish movement in the long-term outlook. The bullish breakout at the resistance level of $398 has pushed the price to test the resistance level of $448. The crypto was on the ranging mode within $329 and $398 levels before the breakout. The price broke up the resistance level of $398 on March 22. The price increases and tests the resistance level of $448 at present time.
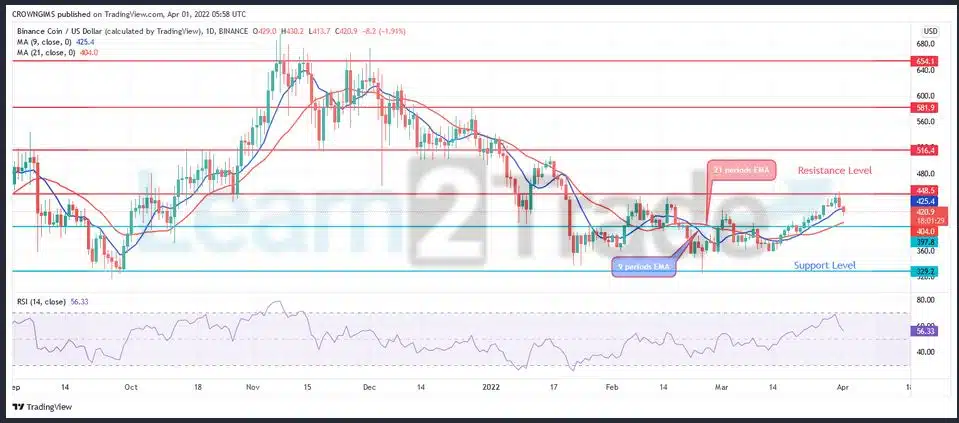
The fast moving average has crossed the slow moving average upside. The price is trading above the 9 periods EMA and the 21 periods EMA at close contact as an indication of low bullish movement. The price has increased to the $448 level and when the daily candle closes above it, the price may increase to $516, and may expose the price to the $581 resistance level. In case there is an opposition by the bears at the resistance level of $448, the price may decrease towards the support levels of $382, $329 and $256. The relative strength index period 14 is at 57 levels pointing downside to indicate sell signal.
BNBUSD medium-term Trend: Bearish
The Binance Coin is on the bearish movement in the 4-hour chart. The coin was under the control of the bulls last week. The bullish momentum increases and the price increased accordingly to the resistance level of $448. The just mentioned level was defended by the bears. The price is currently pulling back towards the support level of $398.
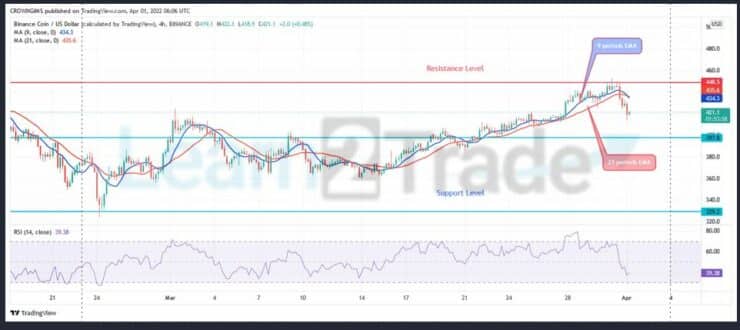
The 9 periods EMA is trying to cross the 21 periods EMA downside to establish a bearish movement. Meanwhile, the price is trading below the two EMAs as an indication of bearish movement. The Relative Strength Index period 14 is at 46 levels displaying a bearsh direction.
You can purchase Lucky Block – Guide, Tips & Insights | Learn 2 Trade here. Buy LBlock:
- Broker
- Min Deposit
- Score
- Visit Broker

- Award-winning Cryptocurrency trading platform
- $100 minimum deposit,
- FCA & Cysec regulated

- 20% welcome bonus of upto $10,000
- Minimum deposit $100
- Verify your account before the bonus is credited
- Fund Moneta Markets account with a minimum of $250
- Opt in using the form to claim your 50% deposit bonus
Learn to Trade
Never Miss A Trade Again

Signal Notification
Real-time signal notifications whenever a signal is opened, closes or Updated

Get Alerts
Immediate alerts to your email and mobile phone.

Entry Price Levels
Entry price level for every signal Just choose one of our Top Brokers in the list above to get all this free.