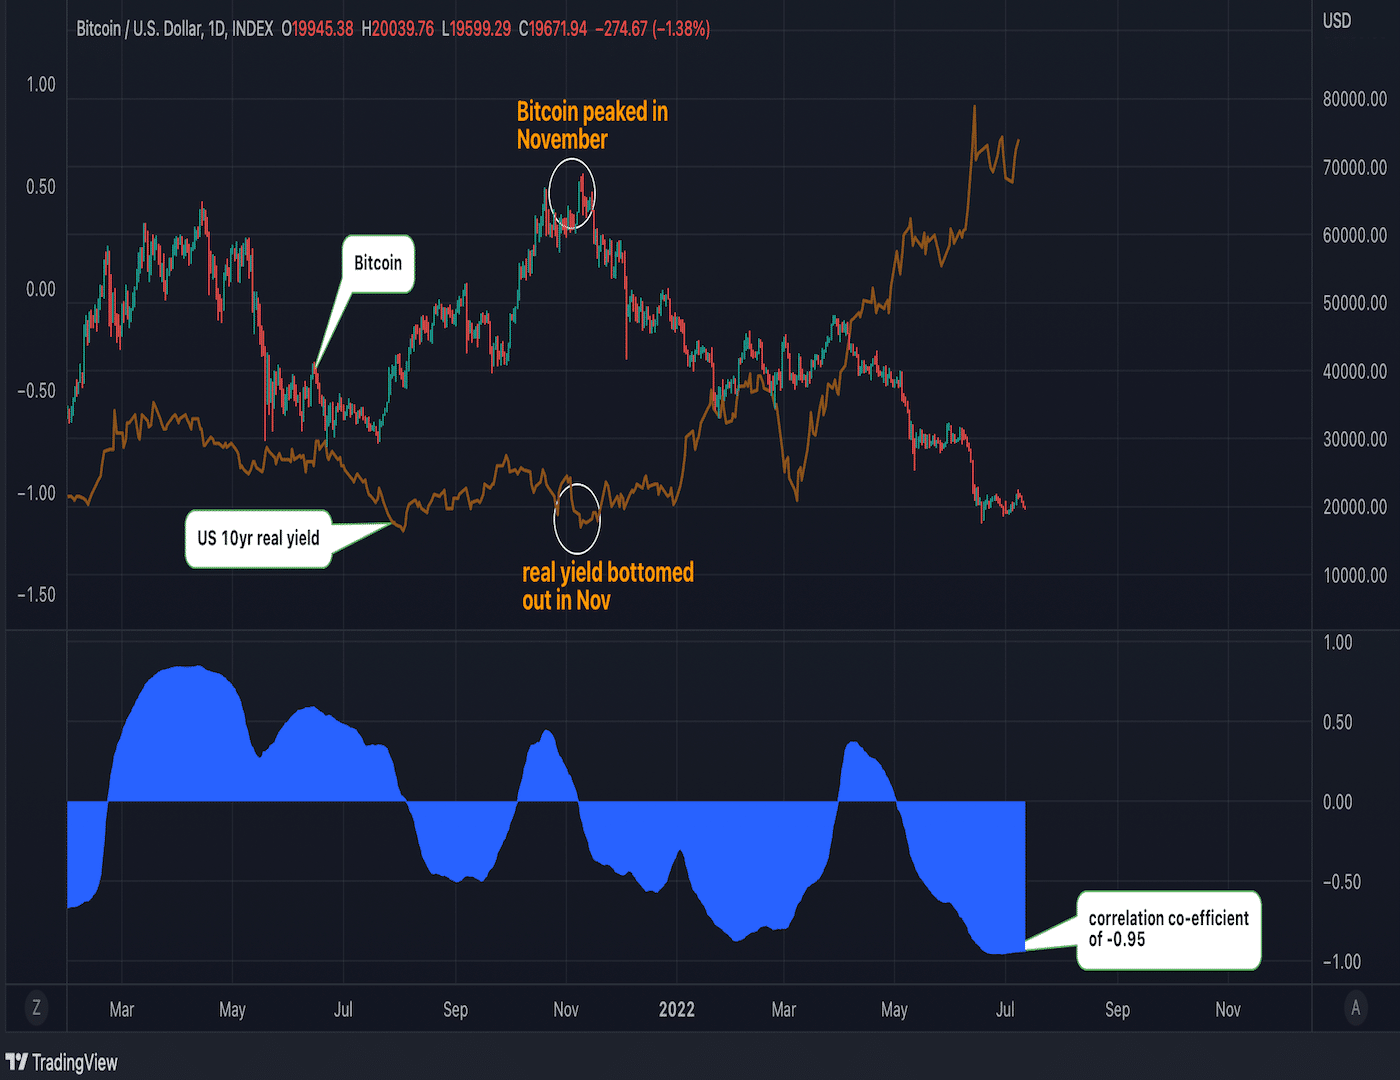
Reports show that Bitcoin (BTC) has become more closely tied to the US real or inflation-adjusted bond yield in recent times, with the two becoming increasingly polarized with each other.
Currently, data from CoinDesk shows that the 90-day correlation coefficient between the flagship cryptocurrency and the yield on the 10-year US Treasury bond neared the -0.95 peak recorded in late June.
The current inverse correlation indicates that Bitcoin is on an inverse trajectory compared to the inflation-adjusted yield. For better understanding, a correlation coefficient falls anywhere between +1 and -1, representing the linear interdependence of both sets of data. That said, a correlation coefficient of -1 means the relationship between both assets is negative 100% of the time. At the same time, a correlation coefficient of +1 means both assets move 100% in the same direction.

The report further detailed that a positive real yield indicates the market-based measures of inflation expectations. As a result, a higher real yield translates to a lower incentive to purchase assets like cryptocurrencies, stocks, and gold.
This explains why Bitcoin, tech stocks, and gold have suffered heavy losses this year alongside a bullish pattern in the real yield. At press time, the real yield has surged by over 172 basis points (bps) to 1.72%, thanks to sentiment support from the US Fed’s decision to mop up liquidity with aggressive interest rate hikes and balance sheet tapering.
Key Bitcoin Levels to Watch — July 12
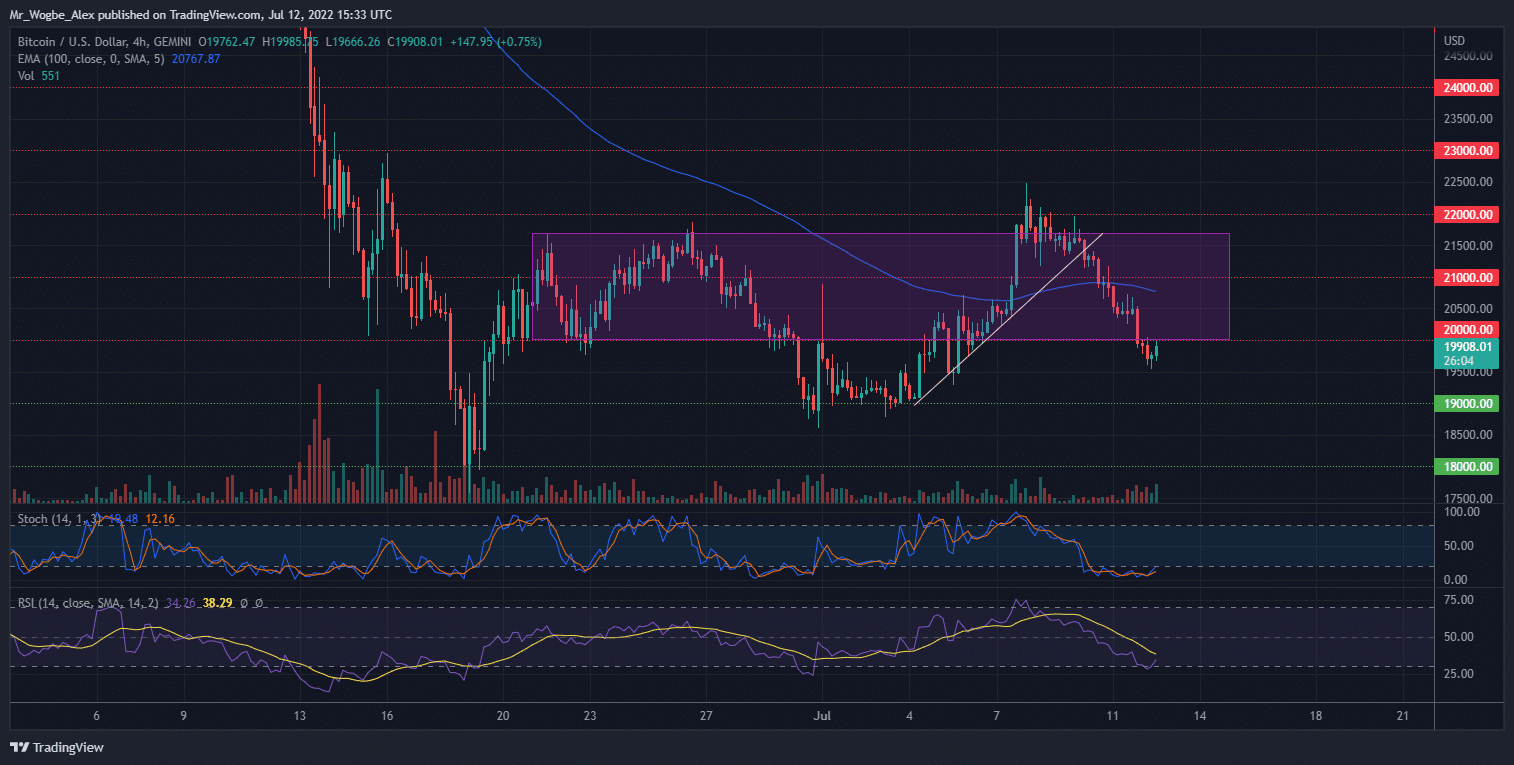
In an unexpected turn of events, Bitcoin suffered a breach below the $20,000 consolidation zone after a three-day slump from the $22,000 area. The 4-hour Stochastic indicator now scrapes below the critical 20.00 base, highlighting the absence of any opposing bullish force.

That said, a bearish resumption to the $19,000 level, and possibly $18,000, return on the cards. In the meantime, any rebound attempt from this level should be repelled by the 100 EMA at the $20,700 mark.
Meanwhile, my resistance levels are at $20,700, $21,000, and $22,000, and my key support levels are at $19,000, $18,000, and $17,000.
Total Market Capitalization: $886.2 billion
Bitcoin Market Capitalization: $380.3 billion
Bitcoin Dominance: 42.9%
Market Rank: #1
You can purchase Lucky Block – Guide, Tips & Insights | Learn 2 Trade here. Buy LBlock
- Broker
- Min Deposit
- Score
- Visit Broker
- Award-winning Cryptocurrency trading platform
- $100 minimum deposit,
- FCA & Cysec regulated
- 20% welcome bonus of upto $10,000
- Minimum deposit $100
- Verify your account before the bonus is credited
- Fund Moneta Markets account with a minimum of $250
- Opt in using the form to claim your 50% deposit bonus
Learn to Trade
Never Miss A Trade Again

Signal Notification
Real-time signal notifications whenever a signal is opened, closes or Updated

Get Alerts
Immediate alerts to your email and mobile phone.

Entry Price Levels
Entry price level for every signal Just choose one of our Top Brokers in the list above to get all this free.


