Don’t invest unless you’re prepared to lose all the money you invest. This is a high-risk investment and you are unlikely to be protected if something goes wrong. Take 2 minutes to learn more
Price activity in the Jito market has been oscillating within a wide range. However, it can be observed that pric action has been moving in this pattern just below the resistance at the $2.250 level. As of the time of writing, the token holds a gain of 0.36%, making it the second most profitable token currently. Let’s see how the market may develop below.
JTO Statistics
Current Price: $2.248
Market Capitalization: $771.55M
Circulating Supply: 337.87M
Total Supply: 999.99M
CoinMarketCap Rank: 94
Key Price Levels:
Resistance: $2.500, $3.000, $3.500
Support: $2.000, $1.500, $1.000
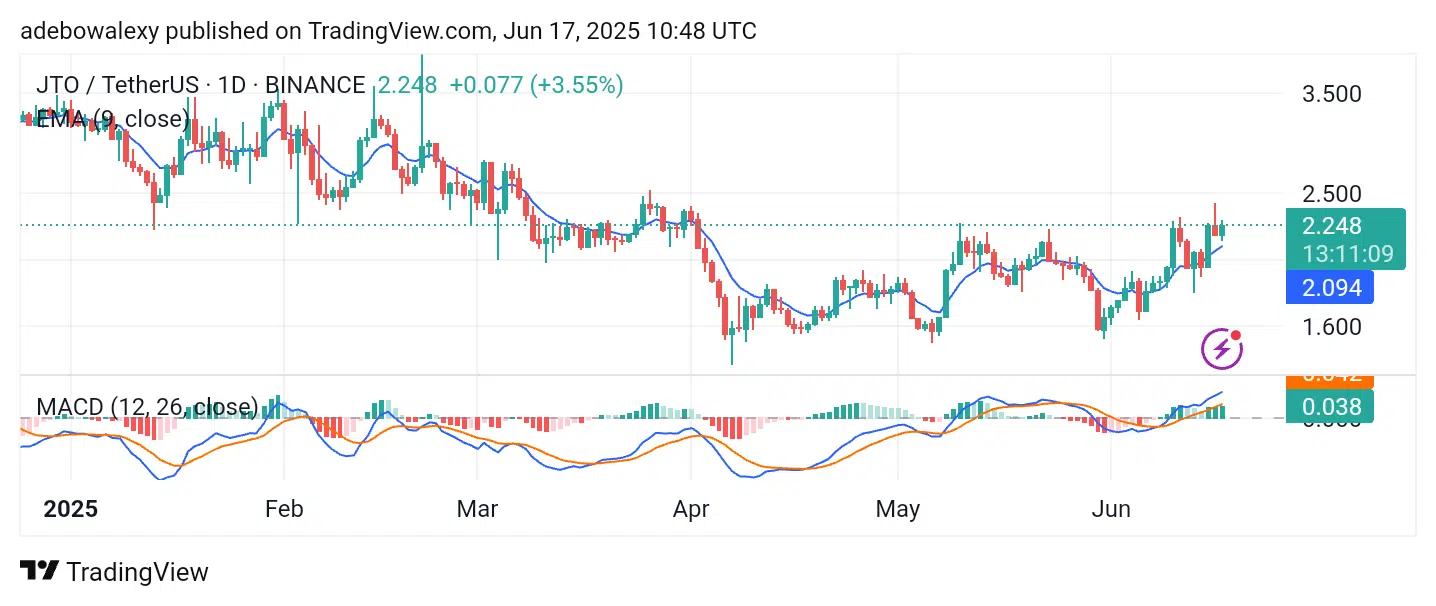
JTO/USDT Faces a Strong Barrier
Price action in the Jito market is now directly facing a strong resistance level. It is therefore critical to evaluate whether bullish momentum can sustain the ongoing upside retracement.
The last price candle on the chart is green and stands above the 9-day Exponential Moving Average (EMA) curve. In addition, the Moving Average Convergence Divergence (MACD) indicator lines are positioned above the equilibrium level. Similarly, the MACD histogram bars appear solid green above the same level, indicating bullish strength.
However, the current price candle displays both upper and lower shadows, suggesting that both bullish and bearish forces are actively contesting control. Nevertheless, the market still seems to have upside potential.
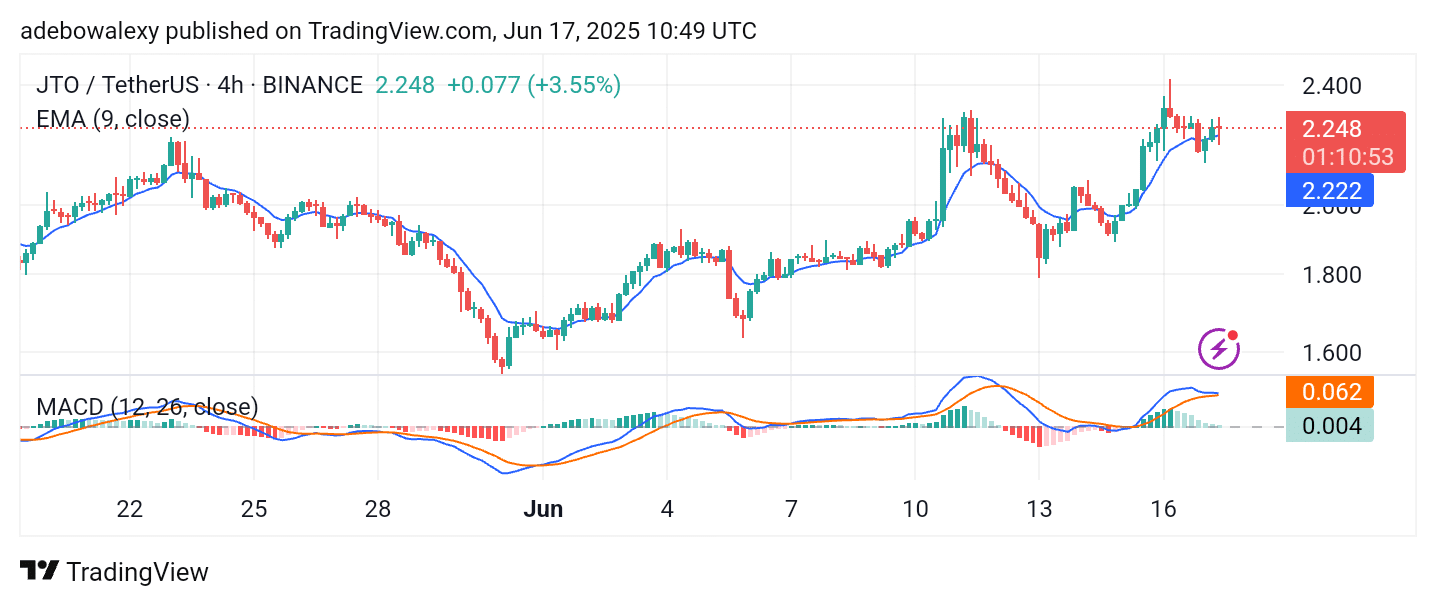
Jito Sees a Rejection but Stays Afloat
On the JTO hourly price chart, price action is again confronting a barrier. The most recent price candle stands above the 9-day EMA line. Although this candle appears red, it is relatively compressed, indicating a tug-of-war between buyers and sellers.
Moreover, the MACD lines remain above the equilibrium level, though their terminals seem to be converging and now exhibit a sideways trajectory. This suggests a potential pause or consolidation phase. Still, support near the $2.220 level may hold firm, allowing bullish forces to push the price toward the $2.500 resistance.
Make money without lifting your fingers: Start trading smarter today
- Broker
- Min Deposit
- Score
- Visit Broker

- Award-winning Cryptocurrency trading platform
- $100 minimum deposit,
- FCA & Cysec regulated

- 20% welcome bonus of upto $10,000
- Minimum deposit $100
- Verify your account before the bonus is credited
- Fund Moneta Markets account with a minimum of $250
- Opt in using the form to claim your 50% deposit bonus
Learn to Trade
Never Miss A Trade Again

Signal Notification
Real-time signal notifications whenever a signal is opened, closes or Updated

Get Alerts
Immediate alerts to your email and mobile phone.

Entry Price Levels
Entry price level for every signal Just choose one of our Top Brokers in the list above to get all this free.