

In recent days, the Japan 225 has continued to slide lower. It appears that the mixed fundamentals surrounding this market have contributed to its ongoing decline. Currently, price action has fallen below key technical levels, indicating increasing bearish potential.
Key Price Levels
Resistance: 39,000, 39,500, 40,000
Support: 38,000, 37,500, 37,000
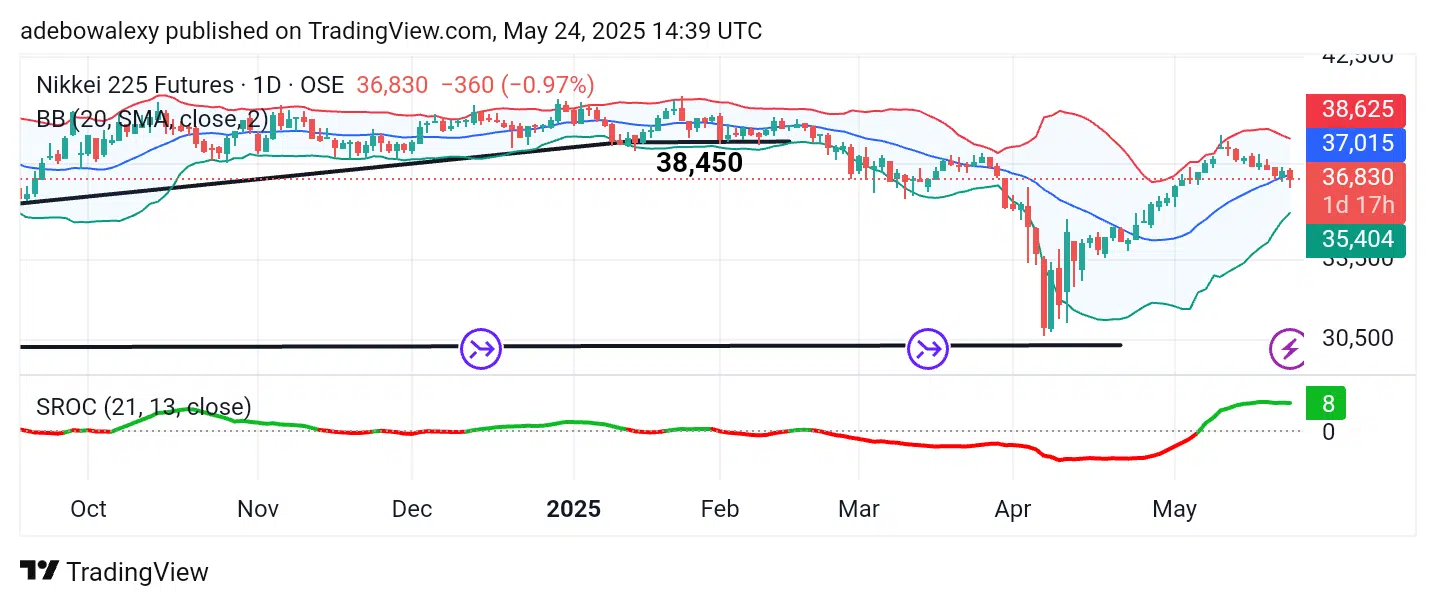
Nikkei 225 at Risk of Further Decline
The latest price candle on the Japan 225 chart has slid below the middle Bollinger Band, a technical signal that price action is becoming more vulnerable. Despite this, momentum has remained relatively steady. However, the price candles appear to be contracting further as price action continues to regress.
As a result, the lines of the Smoothed Rate of Change (SROC) indicator remain above the equilibrium level but are moving sideways, suggesting uncertainty. Overall, the position of the last price candle suggests that further downside movement is likely.

Japan 225 Remains Vulnerable
On the 4-hour chart, price activity continues to face downward pressure. The most recent candle is red, indicating a sustained retracement. Price action is positioned below the middle Bollinger Band, while the bands themselves have narrowed, pointing to reduced volatility.
The SROC indicator lines are now below the equilibrium level, with its terminal turning red—signaling a persistence of bearish sentiment in both the short and long term. Nonetheless, traders should remain attentive to upcoming economic data releases that may influence market direction.
Make money without lifting your fingers: Start trading smarter today


