

With the anticipated Fed rate cut still in view, investors are exercising caution around the USD, keeping it on a losing streak. Meanwhile, the Japanese economy is showing improvement in Producer Prices, which have risen by 2.7%. This has supported the Japan 225 market, allowing it to edge higher.
Key Levels
Resistance: 51,000, 52,000, 53,000
Support: 49,000, 48,000, 46,000
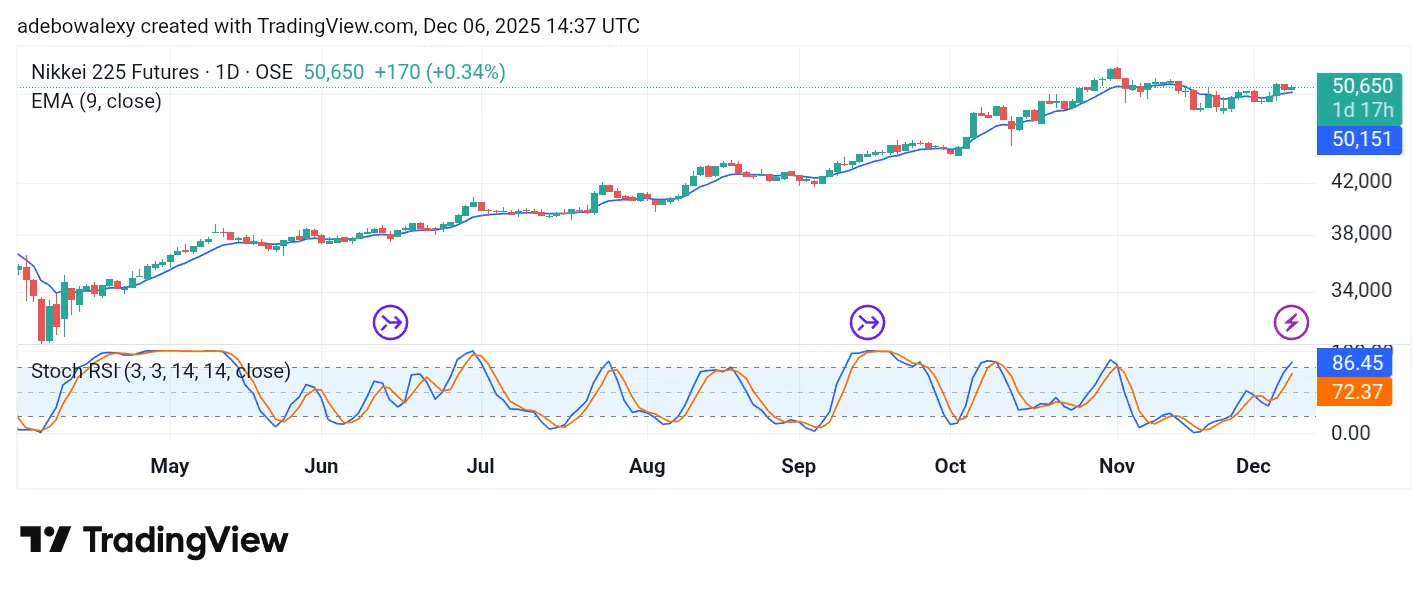
Japan 225 Finds a Lofty Perch
The NIKKEI 225 daily chart shows that the market experienced notable price increases over the past week. As a result, the index now trades above the 9-day Exponential Moving Average (EMA) curve.
The last candle on the chart is also green, indicating that bullish pressure dominated the week’s final session. Additionally, the Stochastic Relative Strength Index (SRSI) lines continue to trend upward, with the lead line now piercing through the 80 mark. Technically, this suggests that the market may maintain its upward trajectory.

NIKKEI Market Stays Composed
On the 4-hour Japan 225 chart, price action remains above the 9-day EMA curve. The latest candle is red but still keeps the index trading above a key level, as the bearish movement is minimal.
The SRSI indicator lines are tilted toward a bearish crossover, which has occurred around the 20 mark. This hints at a possible downward correction. However, the fact that trading continues above the 9-day EMA suggests that the market may still rebound from the 50,559 price level.
Make money without lifting your fingers: Start trading smarter today


