Key Resistance Zones: 23200, 23600, 24000
Key Support Zones: 20800, 20400, 20000
Japan 225 (JP225USD) Long-term Trend: Ranging
The index is fluctuating between levels 22000 and 23700. The price is trading close to the resistance zone. Buyers are unable to break above it. The price finds support above the SMAs after it is repelled at the resistance level. The market now consolidates in the middle of price range.
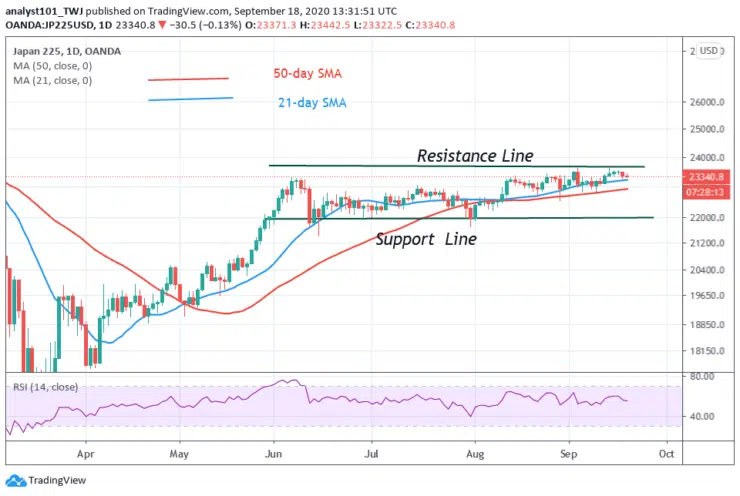
Daily Chart Indicators Reading:
Japan 225 is at level 55 of the Relative Strength Index. It indicates that the market is in the uptrend zone and above the centerline 50. The 21-day SMA and 50-day SMA are sloping sideways indicating the sideways move.
Japan 225 (JP225USD) Medium-term Trend: Ranging
On the 4- hour chart, the market is in a sideways move. It is currently fluctuating between level 22840 and 23600. The price action is fluctuating in the middle of the price range. The index is currently approaching the resistance to break above it.
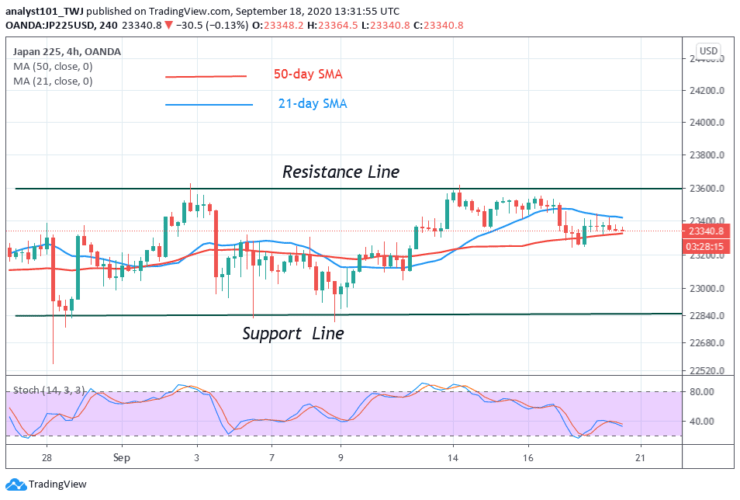
4-hour Chart Indicators Reading
The 21-day SMA and the 50-day SMA are sloping horizontally indicating the sideways move. JP225USD is above the 30% range of the daily stochastic. It implies that the market is in a bullish momentum.
General Outlook for Japan 225 (JP225USD)
Japan 225 index is in a sideways trend. The index currently fluctuates between level 22000 and 24000. Previously, the index is in an uptrend before the sideways move. Japan 225 index is in a sideways trend
Note: Learn2Trade.com is not a financial advisor. Do your research before investing your funds in any financial asset or presented product or event. We are not responsible for your investing results
- Broker
- Min Deposit
- Score
- Visit Broker

- Award-winning Cryptocurrency trading platform
- $100 minimum deposit,
- FCA & Cysec regulated

- 20% welcome bonus of upto $10,000
- Minimum deposit $100
- Verify your account before the bonus is credited
- Fund Moneta Markets account with a minimum of $250
- Opt in using the form to claim your 50% deposit bonus
Learn to Trade
Never Miss A Trade Again

Signal Notification
Real-time signal notifications whenever a signal is opened, closes or Updated

Get Alerts
Immediate alerts to your email and mobile phone.

Entry Price Levels
Entry price level for every signal Just choose one of our Top Brokers in the list above to get all this free.