Key Support Levels: $50, $40, $30
LTC/USD Long-term bias: Bullish
Litecoin tested the $50 support level in September and rebounded. The bears came again and tested the same support in October and rebounded. The support level is holding as the coin commences a bullish move. In November, the coin’s bullish move has been hampered by the resistance at $64. The bulls have tested the resistance twice but could not breakthrough. We expect a breakout at this resistance.
A breakout will push LTC to a high of $80. Likewise, another movement will propel the price to reach the $100 price level. However, it may not work out easily for the bulls. If the bulls fail to overcome the resistance, the price will retrace and retest the resistance level. On the other hand, the coin will fall and retest the $50 support level.

Daily Chart Indicators Reading:
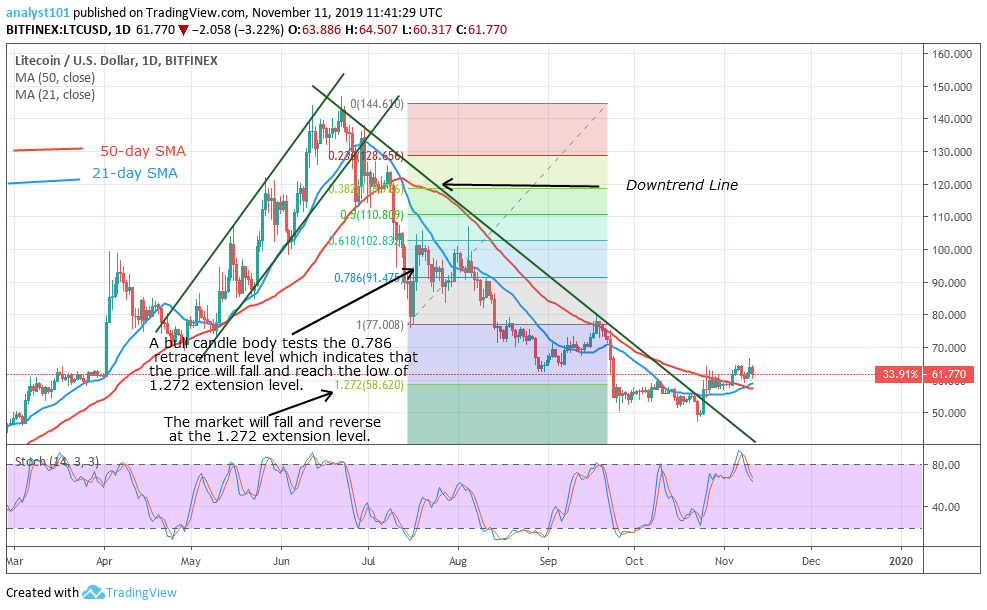
Presently, Litecoin is in the overbought region but below the 80% range of the stochastic. This implies that the coin is in a bearish momentum. The LTC has a bullish crossover which means the coin will rise. Besides, the price breaks the downtrend line which also indicates that the selling pressure may have ended. This has been confirmed by the Fibonacci tool that the market will fall and reverse at the 1.272 extension level.
LTCUSD Medium-term bias: Bullish
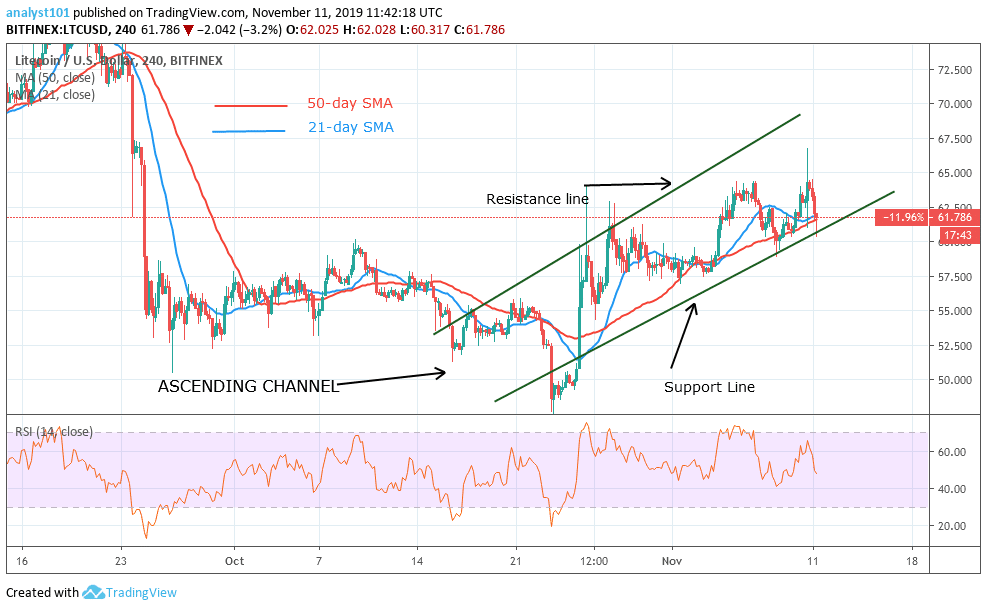
On the 4- hour chart, Litecoin had its bearish impulse on September 24 and consolidated above the $52 support level. After a month of consolidation, the price fell again and found support at the $50 price level. The new support was held as price resumed a bullish movement to the previous highs. The upward move was interrupted as the price tested the $64 price level .
4-hour Chart Indicators Reading
Litecoin is now trading in an ascending channel. The coin will rise if the price breaks the resistance line and closes above it. Likewise, the coin may fall if the price breaks the support line and closes below it. The moving averages are trending northward indicating that price is rising,
General Outlook for Litecoin
The bulls have broken the downtrend line which is a positive move for Litecoin. The price action and Fibonacci tool have confirmed that the selling pressure is over. Litecoin is expected to rise if more buyers are introduced at the upper price levels.
Litecoin Trade Signal
Instrument: LTC/USD
Order: Buy
Entry price: $61
Stop: $50
Target: $80
- Broker
- Min Deposit
- Score
- Visit Broker
- Award-winning Cryptocurrency trading platform
- $100 minimum deposit,
- FCA & Cysec regulated
- 20% welcome bonus of upto $10,000
- Minimum deposit $100
- Verify your account before the bonus is credited
- Fund Moneta Markets account with a minimum of $250
- Opt in using the form to claim your 50% deposit bonus
Learn to Trade
Never Miss A Trade Again

Signal Notification
Real-time signal notifications whenever a signal is opened, closes or Updated

Get Alerts
Immediate alerts to your email and mobile phone.

Entry Price Levels
Entry price level for every signal Just choose one of our Top Brokers in the list above to get all this free.


