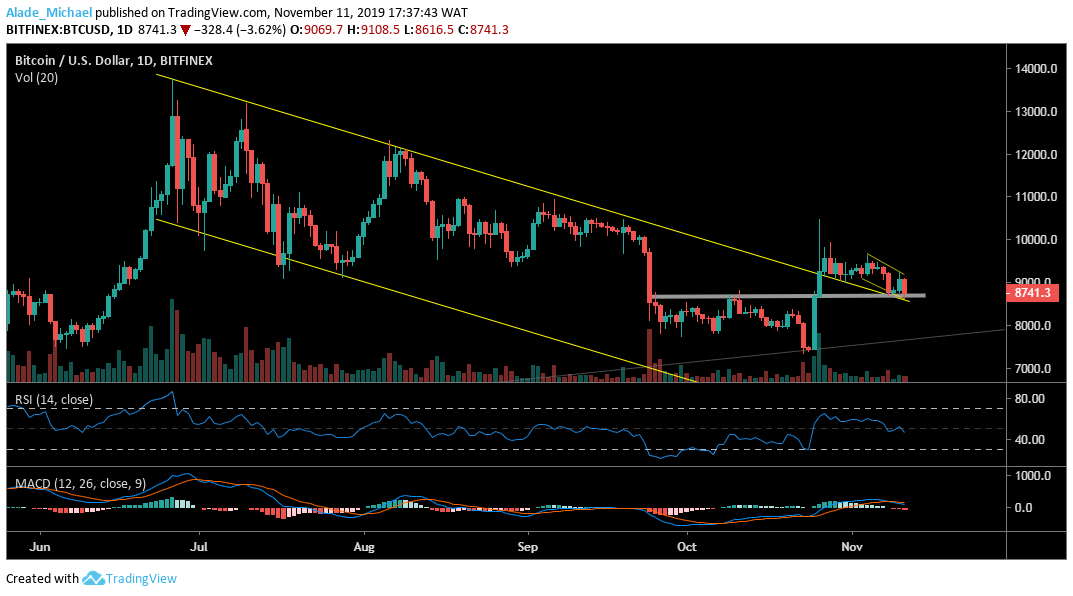
Bitcoin (BTC) Price Analysis: Daily Chart – Bearish
Key resistance levels: $9000, $9400, $9994
Key support levels: $8600, $8300, $8000
Following our previous crypto trading signals, Bitcoin has now found support on the grey horizontal support at $8600 along with the channel’s resistance which has been suppressing selling pressure since late November. If the $8600 support acts strong, BTC is likely to retrace back to $9000 and $9400 – where the primary cryptocurrency struggled to surpass throughout last week.

If the intraday traders can reclaim the $9400 resistance, $9994 would come into play. However, there’s no certainty that the current support will hold. In case a break occurs, Bitcoin may locate support on the grey ascending trend line but $8300 and $8000 may be encountered. Currently, the RSI is on the downside due to the past 15 days of decline. Bullish continuation is likely if the RSI 40 can provide a rebound. On the MACD, the bulls are dominant but might lose control if a bearish cross signals.
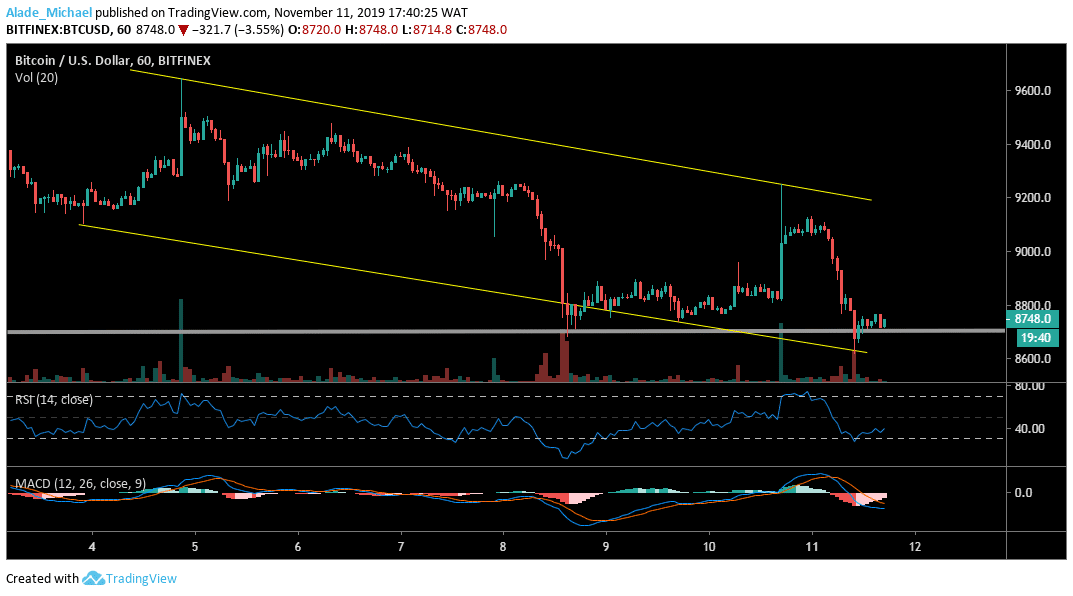
Bitcoin (BTC) Price Analysis: Hourly Chart – Bearish
As predicted earlier today on our crypto trading signals, Bitcoin has eventually fallen to the channel’s lower boundary but has seen a quick recovery back above the grey horizontal support line. BTC is now priced at around $8748. Following the channel formation, Bitcoin is preparing for another upward move. We can see that the market is undergoing consolidation. However, $8900, $9000 and $9125 resistance is likely to play out concurrently.

At the moment, Bitcoin is sitting on the RSI 30. In the opposite direction, Bitcoin may extend its bearishness if the channel’s lower boundary fails to function as support. Nevertheless, Bitcoin might need to break the $8600 before we can see a new low at $8400 and $8200 on the hourly chart. The MACD has shown that the bearish bias is not yet over.
BITCOIN BUY SIGNAL
Buy Entry: $8670
TP: $9000
SL: 8550
- Broker
- Min Deposit
- Score
- Visit Broker
- Award-winning Cryptocurrency trading platform
- $100 minimum deposit,
- FCA & Cysec regulated
- 20% welcome bonus of upto $10,000
- Minimum deposit $100
- Verify your account before the bonus is credited
- Fund Moneta Markets account with a minimum of $250
- Opt in using the form to claim your 50% deposit bonus
Learn to Trade
Never Miss A Trade Again

Signal Notification
Real-time signal notifications whenever a signal is opened, closes or Updated

Get Alerts
Immediate alerts to your email and mobile phone.

Entry Price Levels
Entry price level for every signal Just choose one of our Top Brokers in the list above to get all this free.


