Don’t invest unless you’re prepared to lose all the money you invest. This is a high-risk investment and you are unlikely to be protected if something goes wrong. Take 2 minutes to learn more
Hedera Hashgraph has appeared in the second spot on the crypto top gainers list today. Consequently, this has caused price activity in this market to extend its overall uptrend, which started around the 16th of last month. At this point, the token’s price action has the potential for further upside advancement.
Hedera Hashgraph Statistics:
HBAR Value Now: $0.05356
HBAR Market Cap: $1,736,135,710
Hedera Hashgraph Circulating Supply: 32,519,286,395 HBAR
HBAR Total Supply: 50,000,000,000 HBAR
Hedera Hashgraph CoinMarketCap Ranking: 32
Major Price Levels:
Top: $0.05356, $0.05400, and $0.05500
Base: $0.05300, $0.05200, and $0.05100

Hedera Hashgraph May Have Gained the Needed Support for Further Price Increases
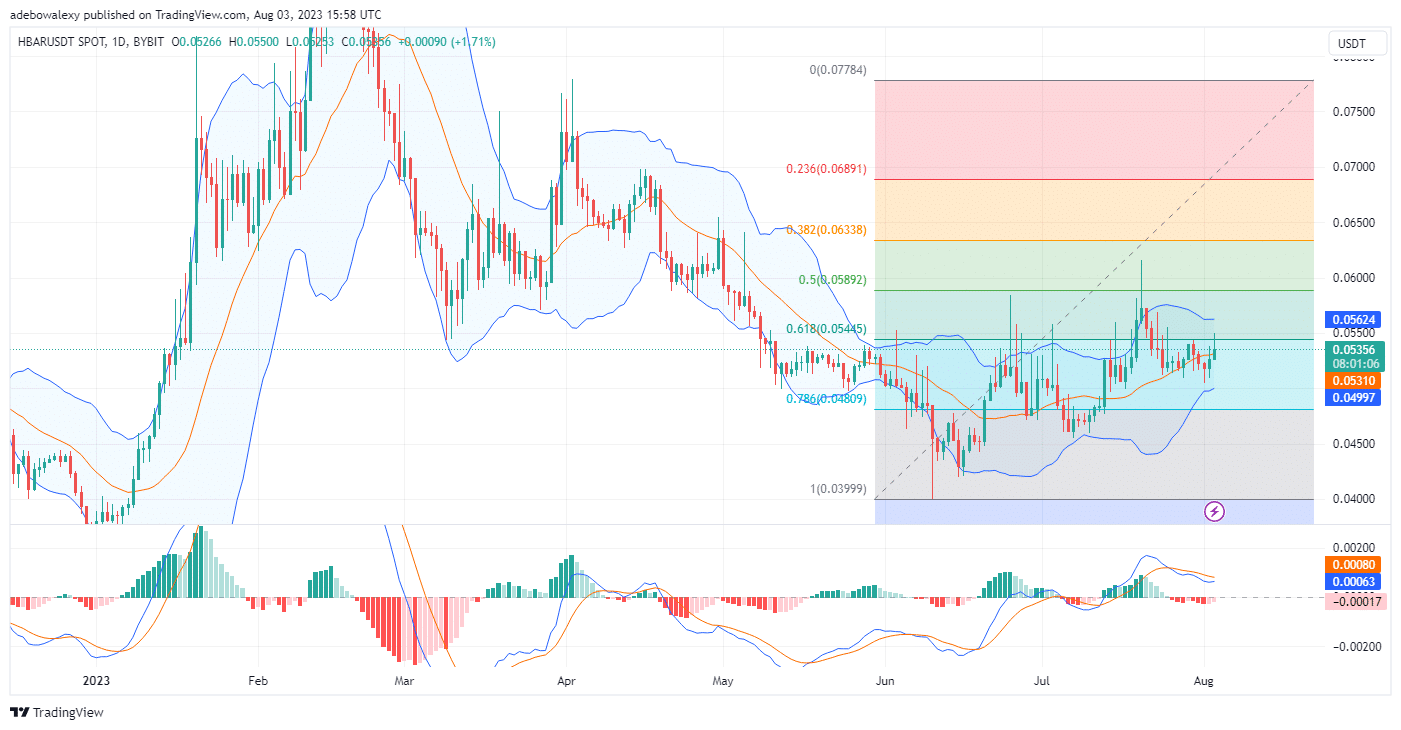
On the Hedera Hashgraph daily market, price action has just broken through an important price level that has bullish implications. The last price candle can be seen poking through the resistance formed by the middle band of the applied Bollinger Bands indicator. Simultaneously, the wick of the same price candle can be seen poking through the 61.80 Fibonacci Retracement level.
Also, the used Moving Average Convergence Divergence (MACD) indicator lines have risen past the equilibrium level in previous trading sessions. However, bearish pressure in previous trading sessions have also caused these lines to trend toward the equilibrium level from above the equilibrium level.
But, following the gains recorded today, these lines seem to have started approaching a bullish crossover above the equilibrium level. This hints that the price may increase further should buyers be able to effect a crossover on the MACD.

HBAR May Witness More Price Increases
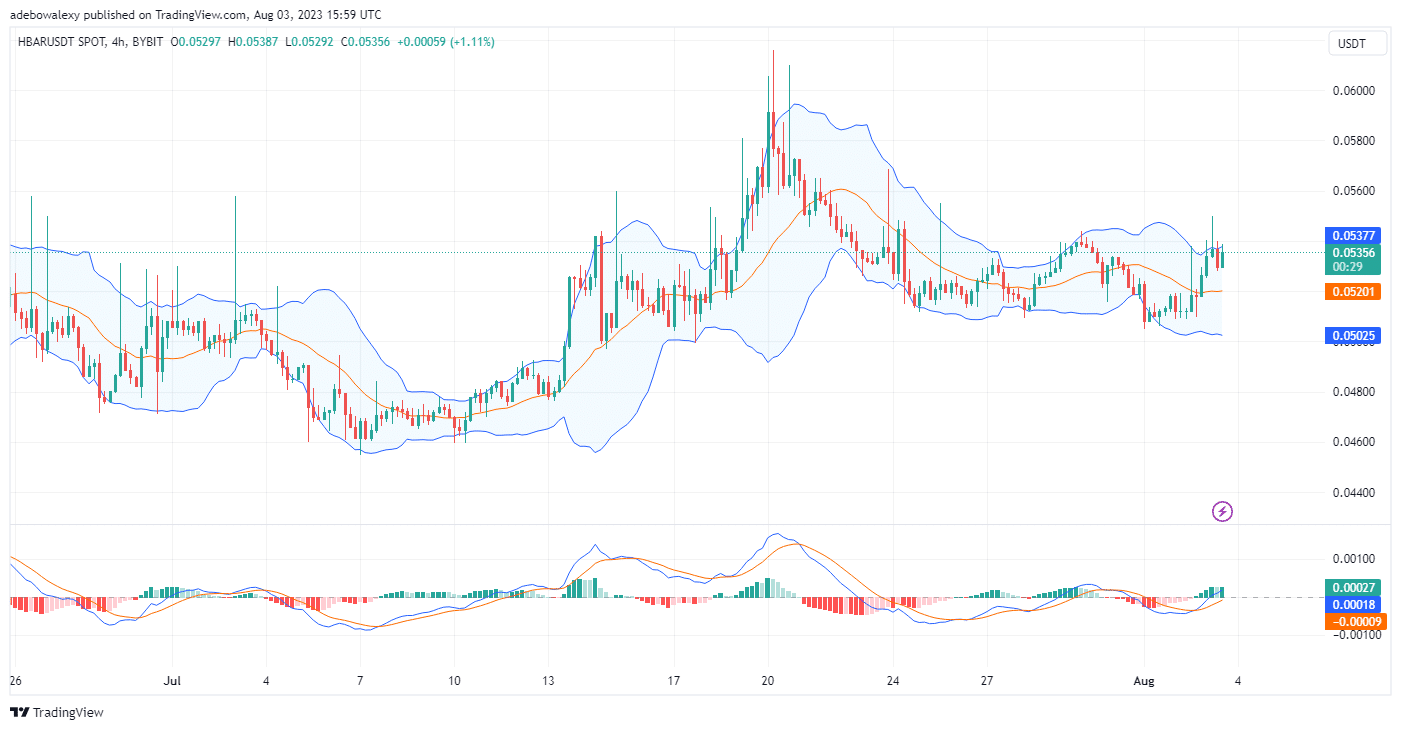
In the Hedera Hashgraph’s 4-hour market, it could be seen that price movements seem to have gathered enough momentum to push the Bollinger Bands envelope further upwards.
In the just concluded trading session, it could be seen that price action has corrected off the uppermost limit of the Bollinger Bands. However, the ongoing session has brought a significant upside recovery as a bullish price candle of almost equal length has appeared on this chart.
Furthermore, the MACD lines are now above the equilibrium level, and its last bar for the ongoing session has regained a solid green color. Consequently, this shows that HBAR’s price action seems to have gained more momentum to advance toward higher price levels around the $0.05600 mark.
- Broker
- Min Deposit
- Score
- Visit Broker
- Award-winning Cryptocurrency trading platform
- $100 minimum deposit,
- FCA & Cysec regulated
- 20% welcome bonus of upto $10,000
- Minimum deposit $100
- Verify your account before the bonus is credited
- Fund Moneta Markets account with a minimum of $250
- Opt in using the form to claim your 50% deposit bonus
Learn to Trade
Never Miss A Trade Again

Signal Notification
Real-time signal notifications whenever a signal is opened, closes or Updated

Get Alerts
Immediate alerts to your email and mobile phone.

Entry Price Levels
Entry price level for every signal Just choose one of our Top Brokers in the list above to get all this free.


