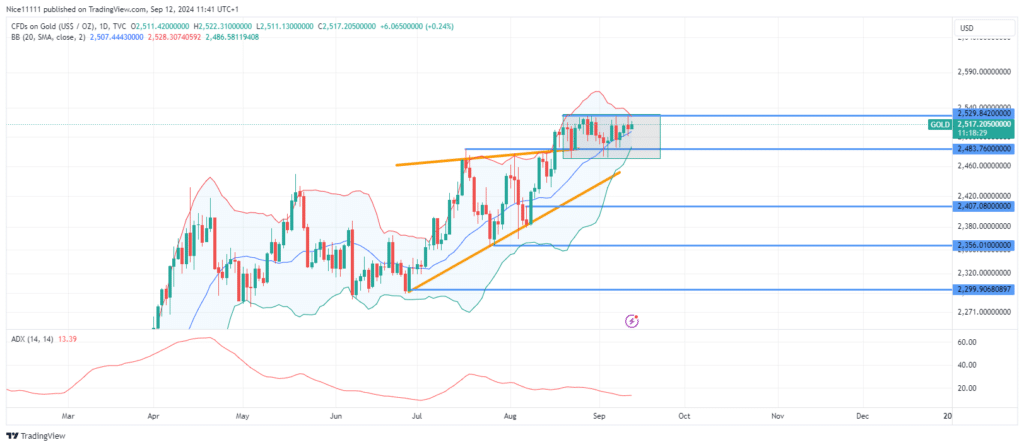
The Gold market has entered a consolidation phase on the daily chart, with price action moving sideways above the previous resistance level of 2483.0. This range-bound movement highlights market indecision, as repeated retests of order blocks on the 4-hour chart have failed to establish a clear direction.
Gold bulls appear to have lost momentum after breaking through the 2483.0 resistance zone. The Average Directional Index (ADX) has notably declined, signaling the absence of a strong trend on the daily timeframe.
The former resistance level, now functioning as support, has been consistently tested, preventing further price drops. The upper boundary of the range remains at 2530.0, solidifying the ongoing consolidation.
Gold Short-Term Trend: Ranging
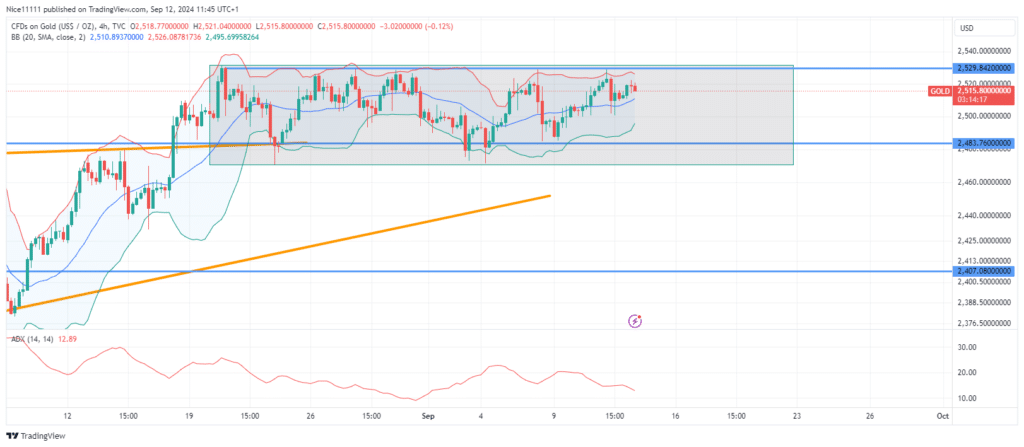
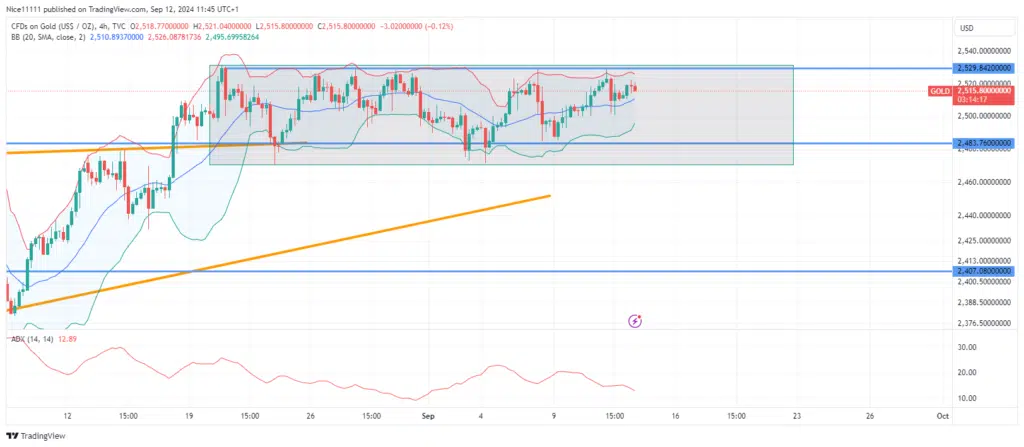
On the 4-hour chart, the Gold market continues to consolidate between the Bollinger Bands, which serve as dynamic support and resistance. Both the upper and lower bands have been tested multiple times, confirming the range-bound behavior. A breakout, either upward or downward, will likely determine the next significant move, showing whether this consolidation is a phase of reaccumulation or signals a potential reversal. Traders looking for forex signals may find this consolidation phase crucial in predicting future price action.
Note: Learn2.trade is not a financial advisor. Do your research before investing your funds in any financial asset, product, or event. We are not responsible for your investment results.
Trade on MT4 with Leverage up to 1:500! Trade on MT4 with Leverage up to 1:500!
X
We use cookies to ensure that we give you the best experience on our website. If you continue to use this site we will assume that you are happy with it.