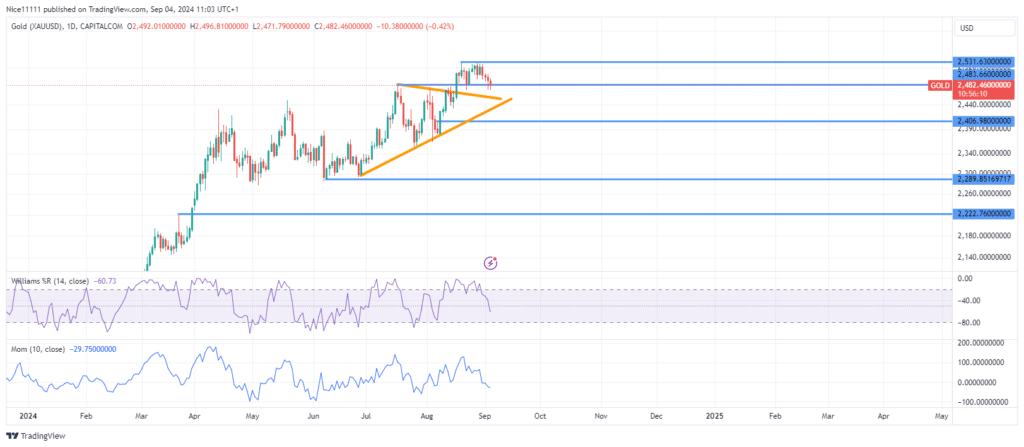
Gold prices are currently stalling just above the previous resistance level of 2,483.0, signaling a loss of momentum for further upward movement. This level, now acting as support, has been tested twice without generating any substantial bullish response.
Gold price recently broke out of a symmetrical triangle pattern, characterized by lower highs and higher lows. This breakout resulted in the formation of a new all-time high at 2,531.0. Following the breakout, the price retraced to test a bullish order block, a zone typically associated with strong buying interest. However, this test failed to push the price into another bullish breakout, leading to a subsequent retest of lower levels.
Although the overall market structure remains bullish, the momentum has clearly weakened. The Momentum indicator confirms the decrease in buying strength, and the Williams Percent Range indicated an overbought condition at the all-time high, which likely contributed to the recent price pullback.
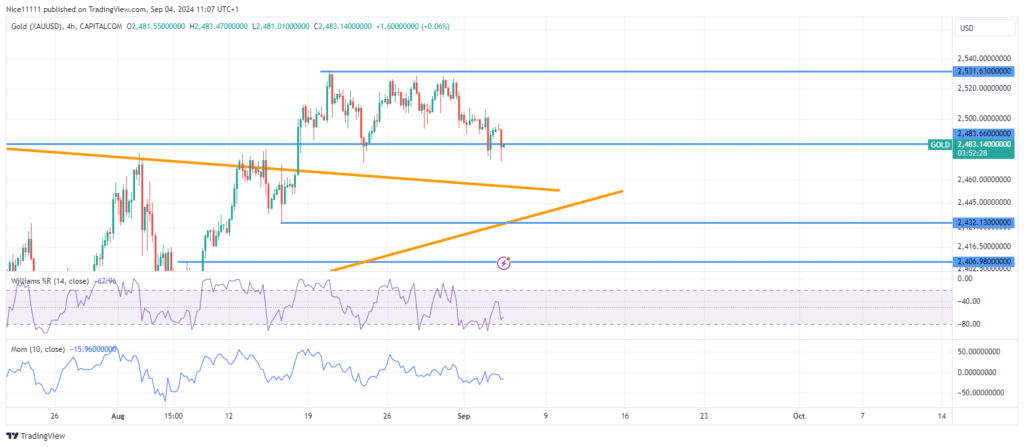
Gold Short-Term Trend: Bearish
On the 4-hour chart, the market has shifted toward a bearish trend. The price decline has temporarily paused at the previous resistance of 2,483.0, which now serves as support. A break below the significant swing low of 2,432.0 would confirm the start of a new downtrend, aligning with forex signals pointing to bearish sentiment in the short term.
Note: Learn2.trade is not a financial advisor. Do your research before investing your funds in any financial asset, product, or event. We are not responsible for your investment results.
Trade on MT4 with Leverage up to 1:500! Trade on MT4 with Leverage up to 1:500!
X
We use cookies to ensure that we give you the best experience on our website. If you continue to use this site we will assume that you are happy with it.