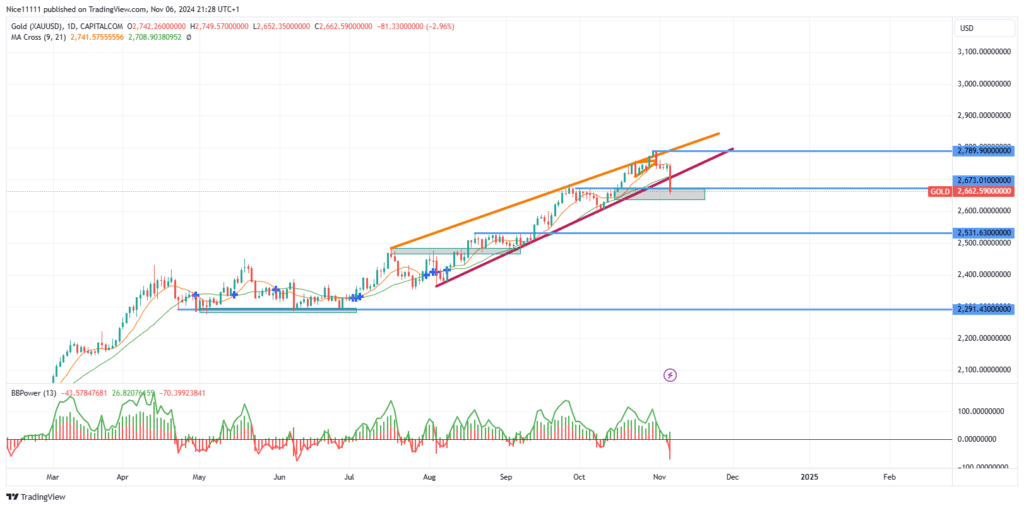
The gold market has entered an uptrend in the third quarter of the year following a prolonged consolidation phase. This upward movement formed a bullish wedge pattern on the daily chart. Recently, however, the wedge pattern broke to the downside, with prices dipping into a bullish order block, signaling a possible pause in bullish momentum.
The bullish wedge pattern has defined the uptrend on the daily chart, with gold buyers largely in control since July. This dominance has been confirmed by the Elder Ray Bull and Bear Power indicator, highlighting consistent buyer strength throughout this period. However, the recent breakout from the wedge shows a shift, indicating notable selling strength on the Elder Ray indicator.
Following the wedge breakout, gold dipped into a bullish order block within the demand zone around 2673.0. Despite the bearish breakout from the bullish channel, the long-term bullish trend remains intact, provided that prices hold above the 2673.0 demand level.
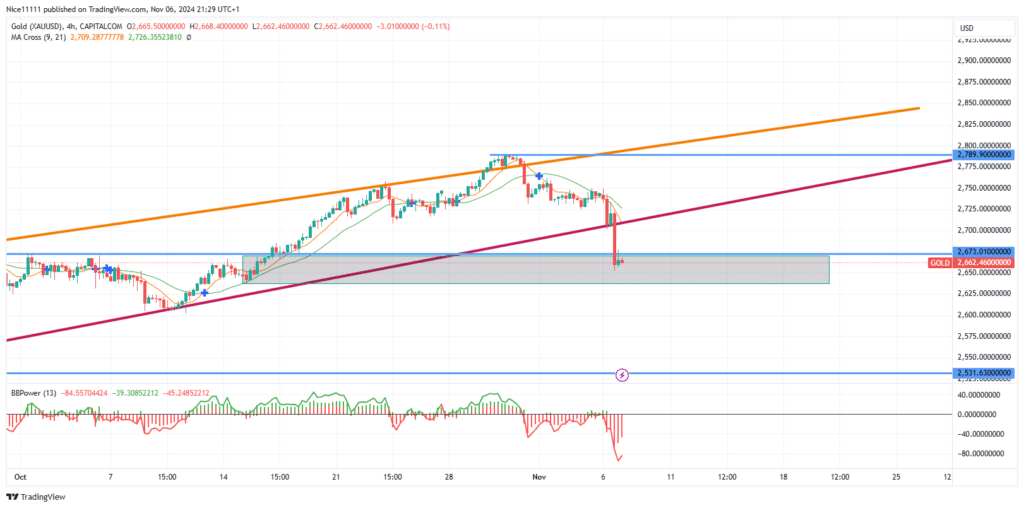
Gold Short-Term Trend: Bearish
In the shorter term, the trend has turned bearish, with the Elder Ray indicator clearly reflecting seller dominance. This shift calls for caution, as observing potential bearish signals on higher timeframes could help avoid sudden stop-outs and reversals, especially if the short-term bearish momentum strengthens. This recent breakout could provide valuable forex signals for traders looking to navigate this evolving trend.
Note: Learn2.trade is not a financial advisor. Do your research before investing your funds in any financial asset, product, or event. We are not responsible for your investment results.
Trade on MT4 with Leverage up to 1:500! Trade on MT4 with Leverage up to 1:500!
X
We use cookies to ensure that we give you the best experience on our website. If you continue to use this site we will assume that you are happy with it.