CHAPTER 4
Now that you wet your toes, we are ready to start swimming lessons… Let’s jump right in. We will now start giving you the basic tools necessary to be a successful Learn 2 Trade trader.
- Chapter 4 – Get Equipped for Learn 2 Trade
- Types of Charts for Learn 2 Trade
- Supply and Demand
- Lines & Trends
- Time Frames
- Trading Styles
- Multiple Time Frames Strategy
- In Conclusion
- Types of Market Analysis
Chapter 4 – Get Equipped for Learn 2 Trade
Now that you wet your toes, we are ready to start swimming lessons… Let’s jump right in. We will now start giving you the basic tools necessary to be a successful Learn 2 Trade trader.
- Charts Types
- Supply and Demand
- Lines & Trends
- Time Frames
- Trading Styles: long, short, day, intraday, swing, scalping
- Multiple Time Frames Strategy
- Types of Analysts
We strongly advise that you to go into the demo account you opened and start practicing the lessons you will learn here. After each subject, you should go to your demo account and practice the new techniques that you just learned. Additionally, at the end of each lesson, you will find exercises to practice with.
Types of Charts for Learn 2 Trade
The data regarding pairs’ rates is presented on Learn 2 Trade trading charts. We use these charts to study and analyze the trends and movements of currencies at any given moment. Every platform offers you a variety of types of charts. Each chart has advantages and disadvantages, and each one is best for specific targets.
At the end of the day, a trader chooses to work with the particular chart that best answers his needs. There is no right answer here, it all depends on the trader’s character and targets.
Let’s have a look at the most common charts:
1. Line chart – Like its name, it is a continuous, line shaped diagram of the currency pairs’ price movement over a chosen period of time. The line connects the closing price of one time range to the opening price of the next time range forming a line. The advantage of line charts is that they help to build a clear picture of price movements and trends through time. They also help you to clearly recognize trends.
2. Bar Chart – Made up of a group of poles which connect the pair’s highest price to its lowest price within a specific time range. It also shows the opening and the closing price of the chosen time range.
3. Candlestick Chart – The Japanese Candlestick Chart system has gained massive popularity since the end of the last century. Today, it is the most popular way to look at charts. This chart contains a group of “candles”. Each candle is a body stretched from opening price to closing price within the particular time range of the candle. It looks a bit like the bar chart, but in our opinion, it is much more intuitive, visually speaking.
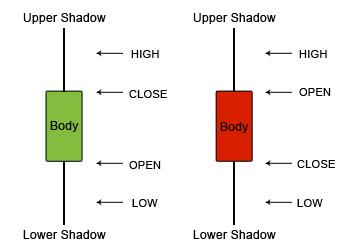
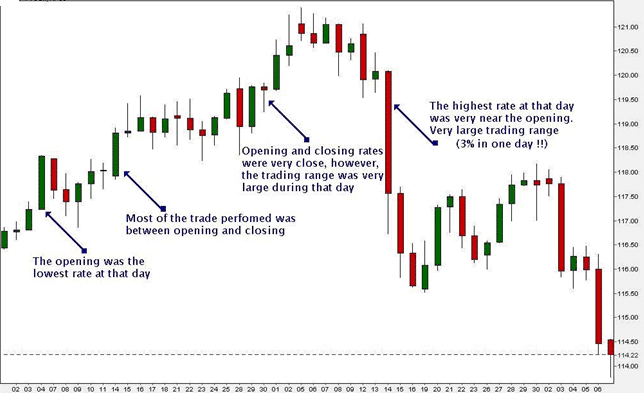
Each candle has four elements, as you will notice in the picture below: Opening, Closing, High and Low. The candle’s body is colored either red or green. Color represents the price direction at that time zone. Green (or white) candles show that prices rose. Red (or black) shows that prices fell.
Long sticks indicate intense activity (buying or selling), while short sticks suggest limited trading activity in the time range of that candle.
Lines above and below the body are called Shadows. Long shadows indicate a lot of action between the opening price and the tip of the shadow – or between the closing price and the tip of the shadow of the time range represented by the candle. Briefer shadows indicate that most of the activity took place around the opening and closing price.
Example of Japanese Candlesticks:
Tip: We love working with Candlestick charts and recommend that you use them as your primary charts. Their structure and colors are very helpful for less experienced traders. Also, it is very easy to use them for trend analyses. Many Learn 2 Trade analyses are based on the candlestick Learn 2 Trade trading strategies.
Let’s take a look at some of the most common types of sticks that you will meet on the platform.
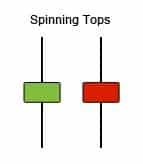
This is a spinning top Japanese Candlestick formation:
Short candles and similarly sized shadow both above and below indicate that there is no decision yet between buying and selling forces on this pair at a particular time. A spinning top’s appearance after a trend can imply a change in the direction of the trend.
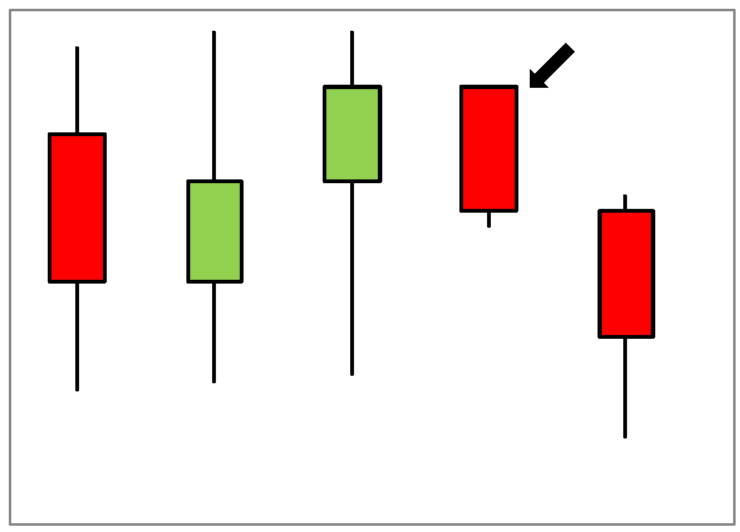
This is a Marabuzo Japanese Candlestick formation:

The green candle indicates a “bully trend” (buyers trend), and the red candle a “bearish trend” (sellers trend). The appearance of a Marabuzo implies an upcoming reversal in the trend direction. The bearish candle, which is bigger than the previous candle, shows that the trend has reached a level where the sellers outnumber the buyers.
This is how Marabuzo Candlestick formation may appear on charts:
This is a Doji candlestick formation:
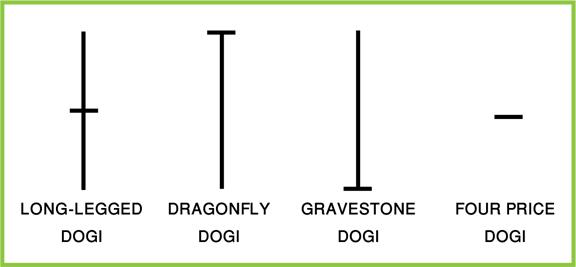
A Doji candlestick formation may form when there is no decisiveness in the struggle between buyers and sellers. Note that the dragonfly doji (or the gravestone doji) are usually referred in Learn 2 Trade as a pin and upside down pin, respectively.
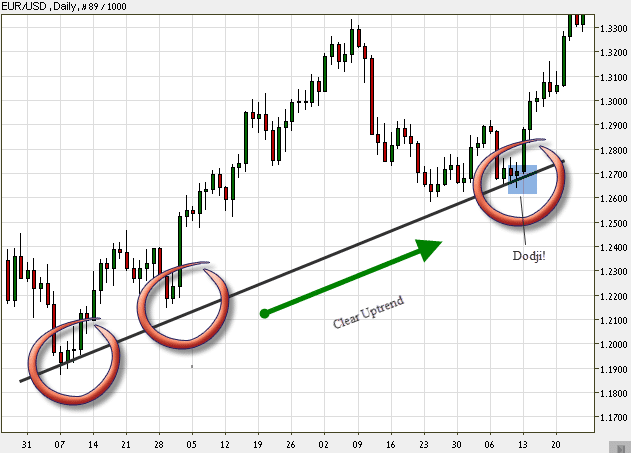
Tip: When a Doji appears right after a Marabuzo, it implies with high probability an upcoming trend reversal!
Single Stick Candlestick Formation:
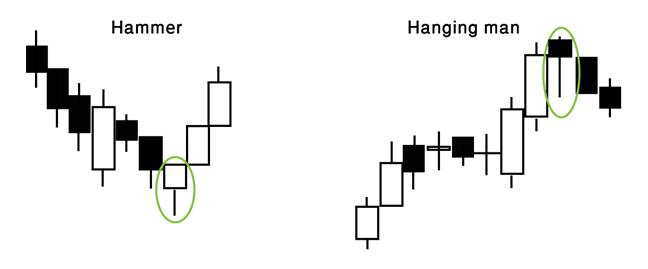
Hammer – Usually followed by a bullish trend (uptrend) after a downtrend. This is an indicator of a reversal. The lower indicates that the sellers were still trying to keep with the bearish trend but the buyers were stronger and brought about a change in directions. Although it indicates a reversal, you shouldn’t rely solely on this single hammer.
Tip: Wait for the next candlestick to come, to decide that a reversal is actually taking place. Identifying marks include a long lower shadow and a disappearing upper shadow.
Hanging Man – The opposite of a Hammer. It can be a peak, which signals the end of an uptrend and the start of a downtrend. It is an indicator that the market is moving in a sell direction.
Inverted Hammer and Shooting Star examples:
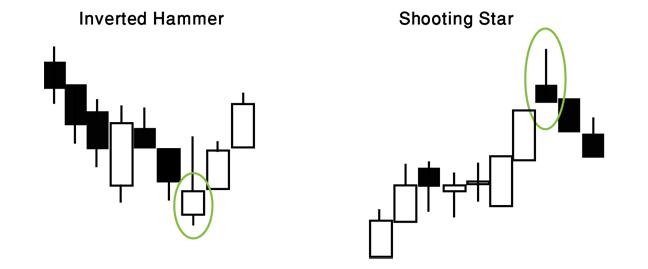
The shadow of an Inverted Hammer indicates that buyers wish to reverse trend direction into an uptrend, however sellers are giving them a hard time; nevertheless, if the stick is white (green) buyers are beating sellers. The pattern indicates a reversal from selling into buying!
Shooting Star works the same, only in the opposite direction – indicating a downtrend.
Two candles
Tweezer Bottom and Tweezer Tops examples:
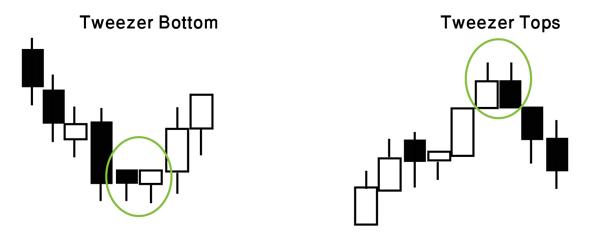
We recognize tweezers when the first candlestick of the two follows a trend and the second candlestick is a reversal, usually they are equal in size and their shadows are more or less the same lengths.
Triple Candles
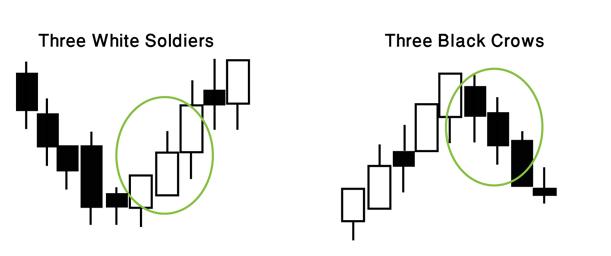
Soldiers and crows: first comes the shortest of all three. This chart pattern points to a clear change in the trend’s directions. In this situation the level of certainty is high (there is a very good chance for a reversal trend!). Notice that the third candlestick shows a tiny shadow (or none at all).
Three White Soldiers and Three Black Crows example:
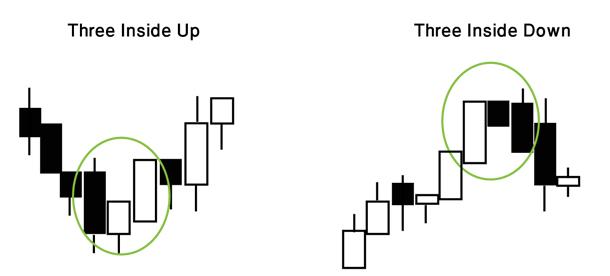
Three Inside Up/Down: Again, both show the same form. The first candle is relatively long and goes with the direction of the trend, the second is approximately half of the length of the first, and the third closes longer than the tip of the first candle and in the opposite direction of the trend.
Three Inside Up and Three Inside Down examples:
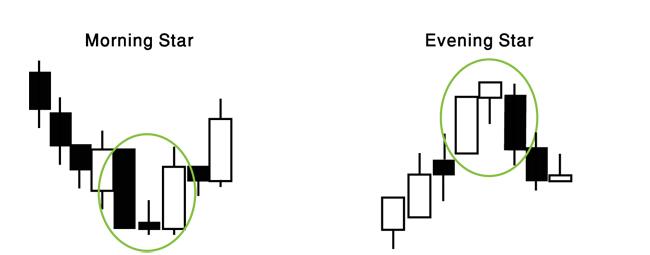
Morning/Evening Stars usually appear at the end of a trend, signaling its end.
Morning Star and Evening Star examples:
This is what it looks on a candlestick chart:
Supply and Demand
In Learn 2 Trade, as in all economic markets, the name of the game is supply and demand. The stronger a currency gets, the larger the global demand for the currency becomes. Several elements impact currency supply, such as inflation, money printing by the central bank and more. Elements impacting demand can include positive growth signals from the national economy, or investors creating demand for a currency by wishing to invest in the national market.
Market Sentiment – the name for the market’s general “state of mind”. It influences supply and demand for different currencies. Market sentiment expresses the feelings and beliefs of the majority of traders about the market. There might be times when it will be opposite to your own analysis or expectations, but you must understand that it reflects the majority point of view. You can’t tell yourself: “everyone is wrong and I am right”. If the majority chooses a certain direction, it is the relevant direction for now. Say a price goes up, it means that most traders feel that way right now and therefore the demand for this pair goes up.
Lines & Trends
Trends are the essence of Learn 2 Trade trading. They are the basis for all of our executions. The trend is your friend as long as you learn to follow and identify them properly.
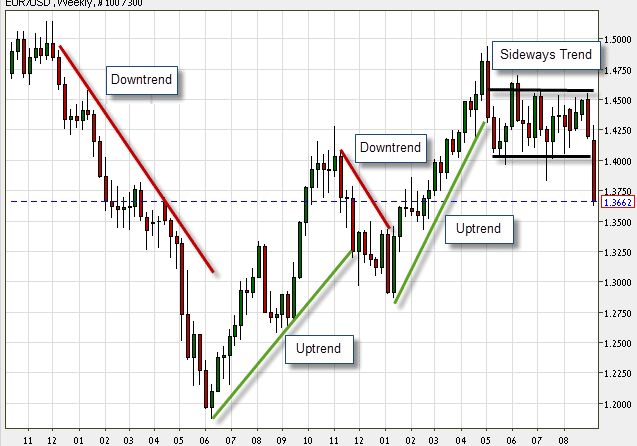
What is a trend? Charts move forward in three possible directions: Up (uptrend), Down (Downtrend), and Flat (Ranging/ Sideways trend). Each trend is characterized by highs (peaks) and lows (troughs). Trend is the prime factor affecting traders’ actions. In Learn 2 Trade jargon, an uptrend is called Bullish (when buying a pair we actually go bullish, or go long), and a downtrend is called Bearish (when selling a pair we go bearish or go short). Notice that in a bullish trend, each peak is lower than its sequential, and vice versa in a bearish trend.
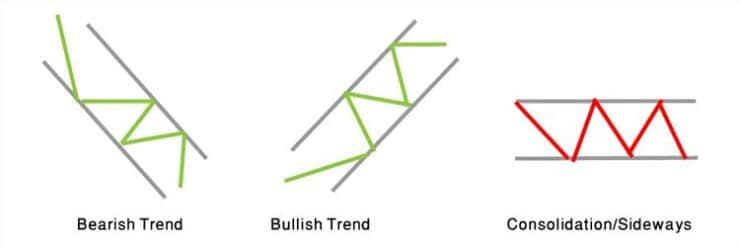
A range-type trend is usually easy to identify, because a trader can visualize a rectangle-like shape which marks out the trend. It is a neutral trend, with the price unable to break out either upward or downward. During this period, it’s best to buy at the bottom and sell at the top. It’s a pretty straightforward strategy.
An example of a ranging trend:
The most important thing to know about a trend is its length, meaning its consistency.
Remember: a trend must contain at least two peaks or two lows in order to be considered as a trend. If it contains three or even more points, we can be quite certain that we are looking at a relatively solid trend.
Trend Lines – the essential technical tool for trend analysis. This is the first technical tool you will meet in the course. It is a very basic, simple and easy to operate tool (You can find it in the toolbox window above the chart, on your trading platform). It is also the most popular tool among Learn 2 Trade traders. By using a pencil drawing on the platform, you can draw a line that connects peaks to peaks and lows to lows along the trend. This trend line will now help you recognize a trend’s direction.
Important: Draw your lines correctly. In other words, do not match your line to the market, but rather the market to your line!
Remember: Many times it is possible to identify changes in the trend’s direction by following breaks in the trend lines. See the examples below:
The blue line in the middle represents the current price (In our case, 1.3662). You will notice that the last candlestick ends at this price.
Another example of trend lines in the Learn 2 Trade market:
Time Frames
For your convenience, we organized this subject in a table detailing the different time frames:
| Time Frame | Details | Pros | Cons |
| Long-term (Investors) | Hold trades for a couple of weeks to a few months or even years. Popular charts are daily and weekly charts. | No need to constantly follow the market.Time to think about each trade, and to analyze it.
Aim for high potential profits per position. |
A lot of patience is required. Potentially longer losing periods (more losing months). A large capital amount is required (in order to enjoy long-term trends). The winning potential is smaller when the trend is not strong. |
| Short term (Swingers) | Hold trades f0r a few hours up to a week. Popular charts are 1-hour chart, 4-hour, and daily. | More trading opportunities. Not reliant upon a small number of winning trades throughout the year. More dynamic trading. Many trading opportunities during ranging periods. Less capital requirement. |
More transaction costs (more spreads on opening positions). Overnight risks (uncertainty regarding open positions). Vulnerable to sudden volatile moves. |
| Intraday (Day Traders) | Hold trades intraday, anything from a few minutes until day’s end. Popular charts are 1-minute chart, 5-minute, and 15-minutes. | Many trading opportunities each day. Money is scattered across a larger number of options. No overnight risk. |
Profits are limited (trades close with the market every day). Much more costs (many spreads to pay). Demands constant involvement – can cause mental stress. |
Trading Styles
There are several popular trading styles. Each style has its own criteria and pattern. Trading style can tell a lot about the characters of the trader himself. Each trader should choose their trading style or trading strategy after self-evaluation and learning. You should figure out whether you like or hate risk, or whether you have enough trading experience to match a particular style. Examine your preferences, your risk/reward ratio, what ratio you are willing to accept between profits and losses etc.
There are aggressive traders and there are calm ones. There are traders who are satisfied with small profits on each trade and there are those who chase the big wins. Each trader is unique.
There is no “best or worst style”. Each has its own pros and cons. That said, we are going to recommend some popular styles which, in our opinion, are well suited for beginner and novice traders.
Let’s get started:
1. Scalpers: Intraday trading. This is a very fast-paced trading style, full of action and excitement. The Scalping Trading Strategy belongs to the “short-term trading” category. Time frames for this type of trading are 1-minute, 15-minute and 10-minute charts. Scalping requires a lot of energy and is a stressful trading strategy. It offers many trading opportunities which you can take advantage of during work breaks or in the afternoon.
2. Day Traders: Categorized as a short-terming style. Traders operate in one, daily trading area. Day traders usually enter trades when trading hours start and exit just before the end of the daily session. It is a more relaxed style than scalping but day trading is also considered quite jumpy. This style requires background preparation and upfront analysis, helping the trader decide on a specific pair. As the day goes by, the trader is able to do more analysis and keep an eye on the charts, checking that all goes as expected, before collecting his profits when trading ends.
Important: Day trading fits traders who can spare a couple of hours each morning to analyze the markets.
3. Swing Traders: This is a longer term trading strategy. Swing trading can last up to a few days. It fits traders with the patience to wait for profitable market trends to come along. This style requires less working hours per day. Swing traders need to spend less time sitting in front of trading platforms than the other trader types. Good swingers can work full-time jobs, simply taking an hour or two at the beginning, or better still, at the end of the day, to analyze the market and decide on how to act the following day. Swinging is usually safer, and sticks to longer trends (most trends last a few days or more).
Important: There are many reversals and changes in a trend’s direction throughout its life. That is why it is important for a swinger to trade with confidence, stick to longer term analysis if he believes that in the long term he is right. In other words, do not let short-term distractions manipulate or disturb your plans.
4. Position Traders: This is one of the longest term trading styles. In this case, trades can last a few months, even a year! It suits traders who are very patient but also very familiar with the Learn 2 Trade “rules of the game “. We are talking about experienced, professional traders. In many cases position traders follow the fundamental economic events only (we will get into this in the “fundamental lesson”). In addition, the position style belongs to “heavier” traders who trade high capital amounts- starting with $10,000 and up.
Important: In order to trade positions one must understand global economics. You need to stay calm and disciplined, and most important, be extremely positive in your trading strategy and analysis. You cannot let disruption of any kind (like trends reversals or losses) blur your vision of the general picture – the framework trend.
Multiple Time Frames Strategy
This is a highly influential trading method! Frankly, you are going to use it a lot of it in your future trades. Multiple time frames is a tracking method on a single pair, but in different time frames. Obviously, charts of the same pair look completely different in different time frames. Selecting the right time frame is subjective for each trader and it is one of the trader’s most important decisions. We already noticed that along a trend there is a series of peaks and lows.
Look at the following Learn 2 Trade chart:
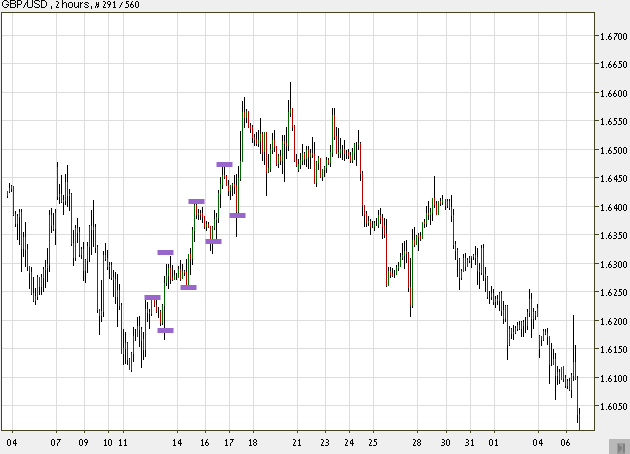
This is a monthly trading chart. The time range of each candlestick in this chart is 2 hours. You can count a total of 360 candlesticks, equal to 1 month. Take a look at the left part and notice the peaks and lows marked as mini-trends (called secondary trends or ‘trends within a trend’), and also notice the general trend direction going up.
If we would have chosen to look at the same trend, but in a different time frame, say of 5 minute ranges in a 2 hour frame (meaning that each stick represents 5 minutes, and a total of 24 sticks in chart), we would have gotten only a partial picture, showing only a small part of the general uptrend.
Assume we wish to take a look at 1 day time ranges (each stick represents 1 day), in a half a year frame (182 sticks) – the chart above would turn into a minor inner part of the whole 6 months chart:
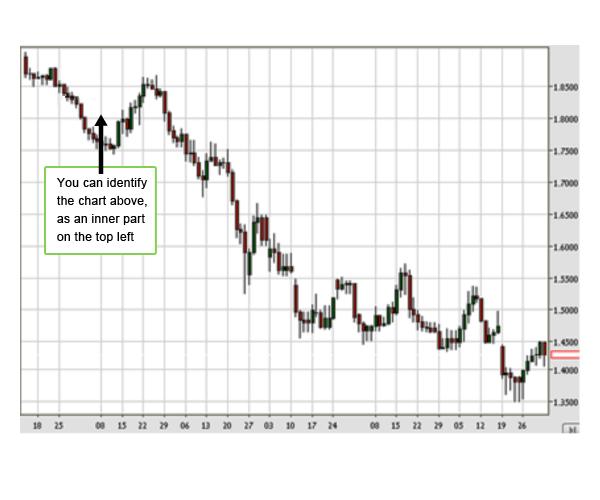
See what just happened?? A trend which clearly looked like an uptrend in a monthly chart turned out to be the beginning of a major downtrend in a 6 months chart!
Conclusion: You must always examine a trade on a number of time frames, in order to get a wide, clear, general view on the market!
Multiple time frames also help us figure out when to enter and exit trades (waiting for critical points).
Check out the following Learn 2 Trade chart:
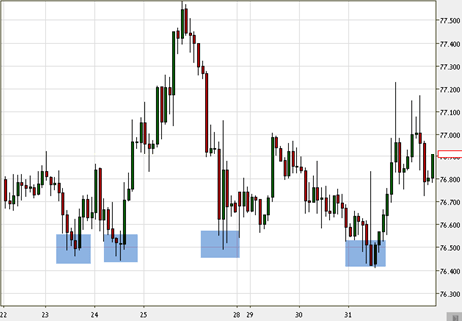
You can see an example of a chart that helps us determine when to either enter or exit.
Tip: 15 minutes, 30 minutes and 1 hour time ranges (where each stick represents trading activity of 15 minutes / 30 minutes / 1 hour) are good, average timeframes, in the middle.
They are short term, but not too short, profitable but not too risky, and allow enough time and significance for the trader to analyze and evaluate markets.
Tip: It is advised to practice on different time frames in your practice accounts, before moving into trading with a real account.
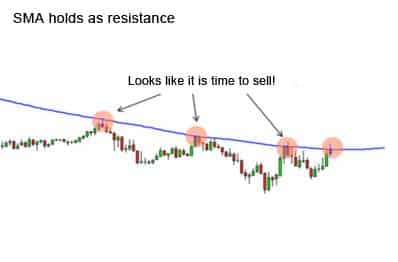
Looking at the top left graph, we would have gone short (sell), because as you can see it looks like the price reached a resistant peak, and from there it was supposed to go down again. But on the next chart (top right picture), we can see that we should have gone long (buy) because we can notice that the price breaks the barrier and moves up drastically. If we would have looked at different time frames (bottom) we could see that the chart’s present position in a long term channel is in the bottom of the channel (bottom left picture), waiting to move up (Plus, notice the Doji which appears in the last low point. You learned that Doji informs trend reversal, remember?).
Tip: The wider the time frames we choose, the stronger and safer trading signals we get from the market.
Recommended working method: When using a certain time frame, you should always test yourselves with the next in line time frame. Even usage of 3 time frames simultaneously is good, but do not go too far. Trying to follow too many charts at the same time will get you seriously confused!
To sum up, working with multiple time frames is most risky if you are a scalper. Due to the speed of price changes and the need for making quick decisions, this method is complicated for scalpers and requires a lot of training. If you are a scalper, do not work with 3 time frames at the same time. Use two maximum.
Example: The following charts represent 3 different time frames of the same Learn 2 Trade currency pair, at the same time. You can see that all three indicate a great buying opportunity!
Daily Japanese candlestick chart (each candle represents one day):
2-hour Japanese candlestick chart (each candle represents 2 hours):
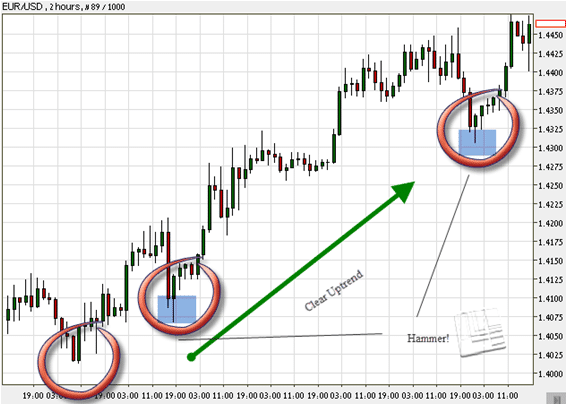
15-minute Japanese candlestick chart (each candle represents 15 minutes):
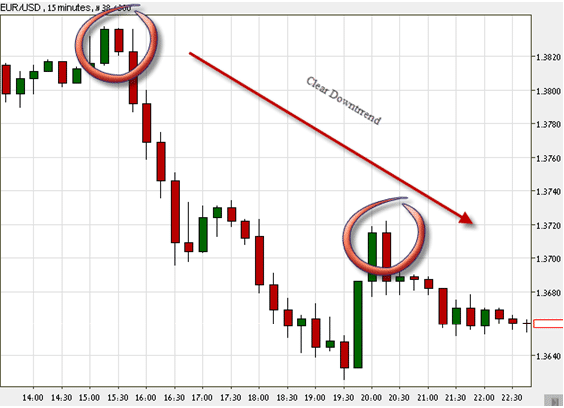
In Conclusion
Long term charts – help you understand the bigger picture.
Medium term charts – present a current picture of what’s going on at the moment and show trading opportunities.
Short term charts – help you determine good entry and exit points.
Types of Market Analysis
In the next four lessons we will explore these analyses in detail, but let’s start by introducing them:
Technical analysis: The most popular trading method in the world, with millions of dedicated technical traders. It focuses on price movements along different time frames. The trader’s target is to forecast future price changes based on the history of the pair which is written on the Learn 2 Trade charts. Prices reflect market conditions and the trader’s basic assumption is that history repeats itself.
Example: Say you are asked to predict the weather in New York tomorrow. Data on the temperatures during the past week and weather charts of N.Y. could have helped you, right? Obviously, your forecast will never be 100% certain, but with this data, there’s a good chance that you will predict the right temperature range.
Technical analysis is the best method, visually speaking. It is excellent for identifying trading opportunities. The problem is that technical analysis is also very subjective! Each trader has his own ideas and observations. Data that appears on the charts is the same on all trading platforms, but analyses and interpretations are different from one trader to another.
Fundamental analysis: Perfect for long-term traders. Great for people who consider themselves investors and heavy players. However, even if you don’t belong to this group, it is extremely important that you familiarize yourself with fundamental analysis because it will help you to dramatically increase your chances for success. Fundamental analysis relates to economic data releases, global economic, social and political events and their influence on foreign exchange markets. For instance, take interest rates, inflation, unemployment rates, elections, natural disasters etc… As conditions in a given market improve, more global investors will invest in this market, causing its currency to rise.
There is no such thing as the best method, one that sweeps away the others. A combination of the two of them is always worthwhile. At the end of the day, you should work with the system that is most comfortable and rewarding for you. Every system has advantages and disadvantages. Our team likes combining fundamental analysis with technical analysis. While analyzing market events, we base our actions and decisions on the technical analysis of the price movements. We also like executing short-term trades based on technical analysis, especially when recognizing clear patterns which can yield nice earnings.
Important: You may, and are even advised to mix the different methods. If you analyze the market with technical tools, fundamental analysis will still improve your performance, and if you are a long-term investor, making decisions based on fundamental analysis, technical tools will boost your success.
If you plan to buy GBP/USD, basing your decision on technical analysis, but suddenly the fourth biggest bank in Great Britain collapses, you can be damn sure that the trend is about to change directions, big time!
Practice!
Let’s review what you learned so far.
Don’t skip this it will help you get comfortable with everything you learned so far and will get you used to using the trading platform of your choosing. Now practice like a real trader!
Go to your demo account and start trading:
- Focus on trading one of the majors. Observe it. Get used to the way it appears on your screens. Check out its buy/sell prices and its Base/Quote currencies.
- Look for a variety of pairs. Check for other majors, minors, exotic pairs
- Look for a timetable which presents the different time zones in all major sessions.
- Find an option which lets you choose your chart type. Focus on candlestick charts; notice the different shapes of sticks. Identify as many types of sticks as you can.
- Look for an uptrend, downtrend and a ranging trend on a chart.
- Find a window called “Tools” and look for a “Trendline” option. Draw an assisting line along one of the trends you see (just like you learned how to do it).
- Choose different time frames to watch a certain pair. Notice how charts of the same pair look totally different in different time frames.
Questions
1. What are the symbols for the currencies in the following countries?
- U.S.A.
- Europe
- Great Britain
- Australia
- New Zealand
- Switzerland
- Thailand
- Hong Kong
- China
- India
- Canada
- Japan
- Singapore
- South Africa
2. What is a ‘major pair’, how many are there? Name them.
3. What is an ‘exotic pair’? Give 2 examples.
4. Do you remember the size of each of the following lots?
- Standard lot
- Mini lot
- Micro lot
5. What happens when you take a “Long position”? or a “Short Position”?
6. Consider this Quote and answer the following questions:
Example Quote 1:
| EUR/ USD | |
| BID | ASK |
| 1.3272 | 1.3276 |
| SELL | BUY |
Base Currency = ?
Counter = ?
Bid price = ?
Ask price = ?
When selling Euros, 1 Euro = ? USD
When buying Euros, 1 Euro = ? USD
Spread = ?
Example Quote 2:
| GBP/ USD | |
| BID | ASK |
| 1.7400 | 1.7410 |
Base currency = ?
Bid price = ?
Ask price = ?
When selling Pounds, 1 Pound = ? USD
When buying Pound , 1 Pound = ? USD
Spread = ?
Pip value = ?
7. What are the 3 most popular currencies in the Learn 2 Trade market?
8. What percentage of market share do they take?
9. Which are the best and busiest trading hours? Why?
10. Time Frames- Complete the following table:
| Cons | Pros | Which time charts? Description | Type |
| It is not necessary to spend a lot of hours in front of your computers.
Relatively few transaction fees and commissions. Allows thorough planning. |
|||
| For 1 hour- 1 day charts usage, Usually trades last 1 day to 1 week | |||
| Intraday |
11. What does a Doji look like and what does it usually mean?
12. Fundamental analysis best suits:
a. Intraday
b. Short term
c. Long term
Answers
1. U.S.A. – (USD); Euro – (EUR); Great Britain- (GBP); Australia- (AUD); New Zealand – (NZD); Switzerland – (CHF); Thailand – (THB); Hong Kong – (HKD); China – (CNY); India – (INR); Canada – (CAD); Japan – (JPY); Singapore – (SGD); South Africa – (SAR).
2. The most powerful currency pairs in the market are the: USD, EUR, GBP, JPY, AUD, CAD, CHF, and NZD. All majors include the US Dollar.
3. A pair that includes one major currency and one exotic currency (USD/THB; USD/BRL)
4. Standard lot = 100,000; Mini lot = 10,000; Micro lot = 1,000
5. Long position – A buying act, when you expect that the price of a pair will increase (become stronger). Buy when the Base currency is expected to gain power against the Counter currency.
Short Position – A selling act, when you expect that the price of a pair will decrease (become weaker). Sell when the Base currency is expected to lose power against the Counter currency.
6. Example Quote 1:
Base Currency= EUR; Counter= USD; Bid price= 1.3272; Ask price= 1.3276
When selling Euros, 1 Euro = 1.3272 USD; When buying Euros, 1 Euro = 1.3276
Spread = 1.3276-1.3272=0.0004
Example Quote 2:
Base currency= GBP; Bid price= 1.7400; Ask price= 1.7410; When selling Pounds, 1 Pound = USD $1.7400; when buying Pound, USD $1.7410 = 1 Pound; Spread = 1.7400 – 1.7410 = 0.0010; Pip value= 0.0001
7. USD, EUR, JPY
8. 85%, 39%, 19%
9. 8-12 am N.Y..T, due to the congruence of two major sessions- N.Y.. and London
10. Time Frames: see above
11. 
Oncoming change in price direction.
12. c. Long term trades.
You did well!
In Chapter 5 – Fundamental Learn 2 Trade Trading Strategies we will dive right into fundamental analysis for Learn 2 Trade trading.
If you are less interested in fundamental trading strategies you can skip straight to Chapter 6 – Technical Learn 2 Trade Trading Strategies and begin with technical analysis.
Remember, the best way to trade Learn 2 Trade signals is by using both Fundamental and Technical trading strategies together.
