

Market Analysis – March 31
GBPUSD is showing signs of a bearish reversal following rejection from a key resistance level. The chart reveals multiple indicators pointing to a potential downward move. The 9-day Simple Moving Average (SMA) at $1.29420 is currently acting as dynamic support, but price action is struggling to sustain bullish momentum above this level. The Relative Strength Index (RSI) is at 61.84, displaying slight bearish divergence as price forms higher highs while RSI forms lower highs, indicating weakening bullish strength. Additionally, the RSI is approaching the overbought zone at 65.50, which could trigger selling pressure in the near term.
GBPUSD Key Levels
Supply Levels: $1.30470, $1.32500, $1.34340
Demand Levels: $1.27140, $1.23000, $1.21000
GBPUSD Long-Term Trend: Bearish
GBPUSD has recently reacted to an Order Block (OB) within a critical supply zone between $1.30000 and $1.30470. The emergence of a Change of Character (ChoCH) near this level suggests a potential shift in market structure from bullish to bearish. Although the trendline supporting the current uptrend remains intact, a break below it could signal further declines. At present, the price is struggling to sustain levels above $1.29500, a key area of interest.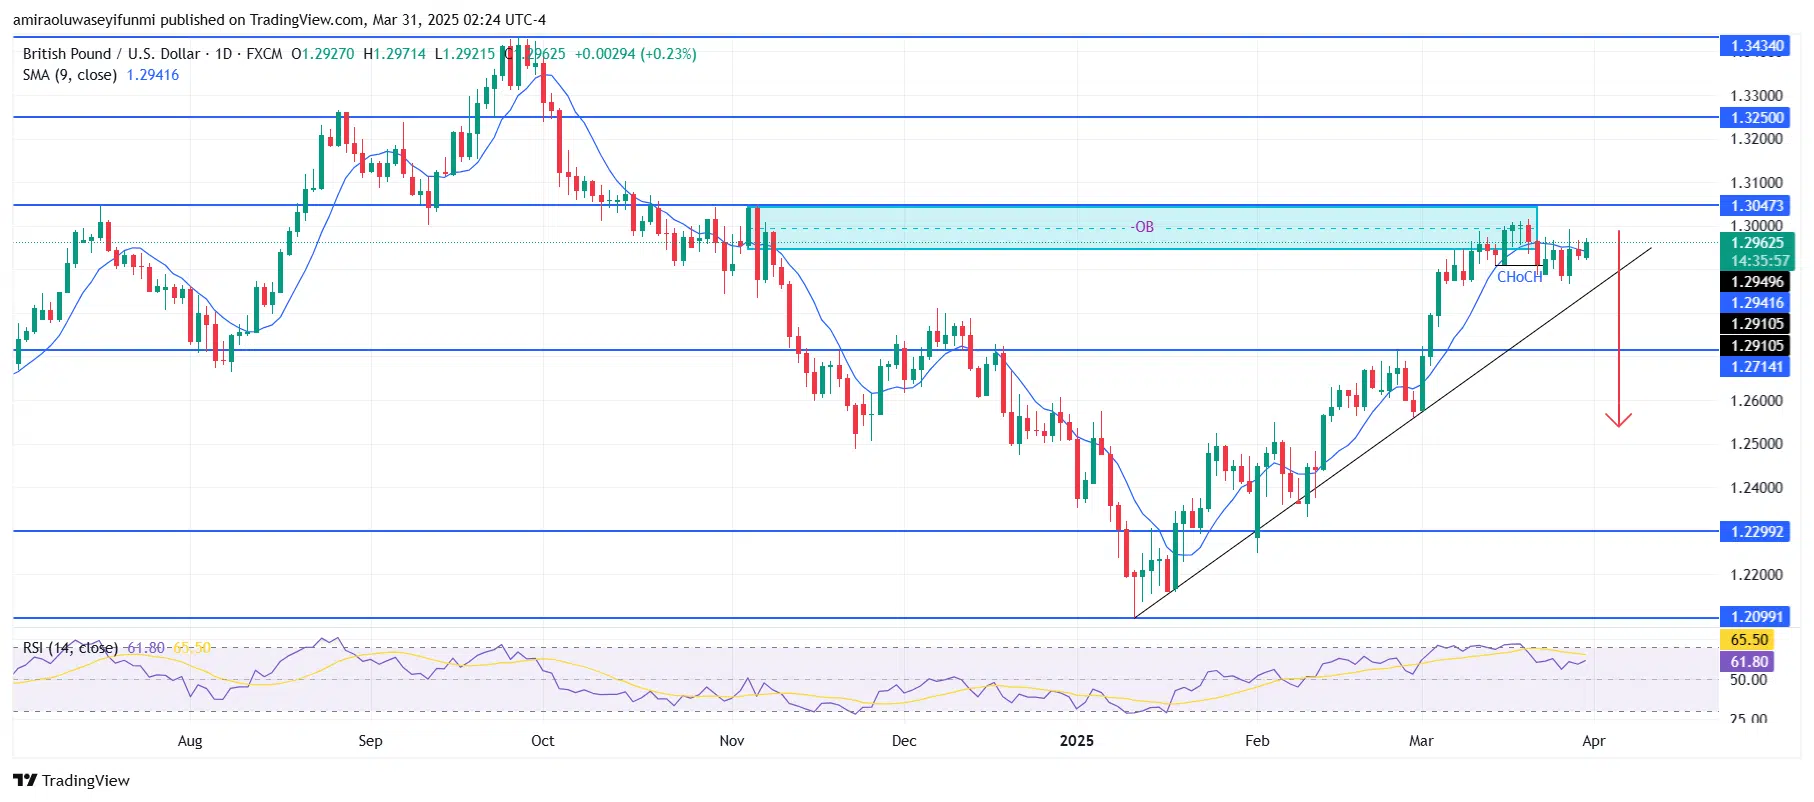
GBPUSD Short-Term Trend: Bearish
Make money without lifting your fingers: Start using a world-class auto trading solution
How To Buy Lucky Block
Note: Learn2.trade is not a financial advisor. Do your research before investing your funds in any financial asset, product, or event. We are not responsible for your investment results.


