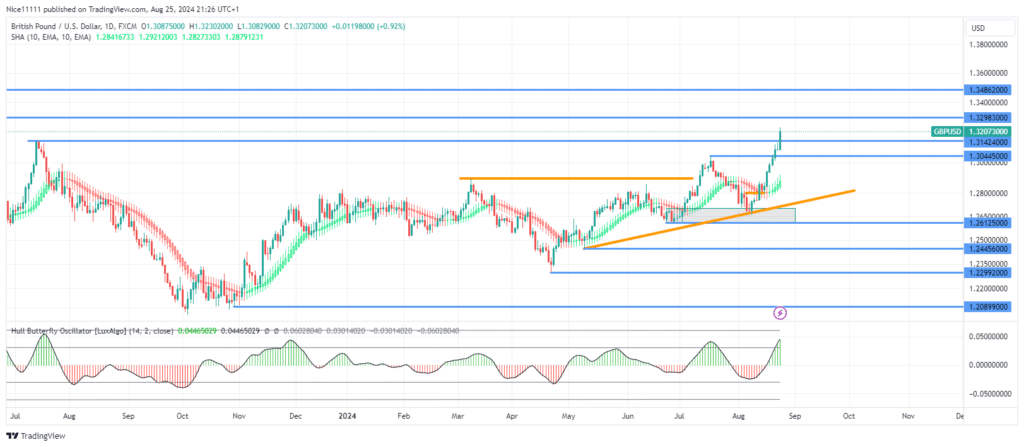
GBPUSD price has surged past the swing high of 1.31420, fueled by seven consecutive days of bullish daily closes. This consistent upward momentum highlights the strong buying pressure in the market, with the price now setting its sights on the next key resistance at 1.32980.
The latest test of the bullish trendline on the daily chart significantly intensified buying pressure, driving the market higher. The GBPUSD price not only broke through the immediate swing high of 1.30450 but also breached the long-term swing high of 1.31420, marking a significant break of structure (BOS) to the upside.
The Hull Butterfly indicator signals strengthening bullish momentum, while the Smoothed Heikin Ashi candles, still showing a green hue below the custom daily candles, confirm the ongoing price rise.
GBPUSD Short-Term Trend: Bullish
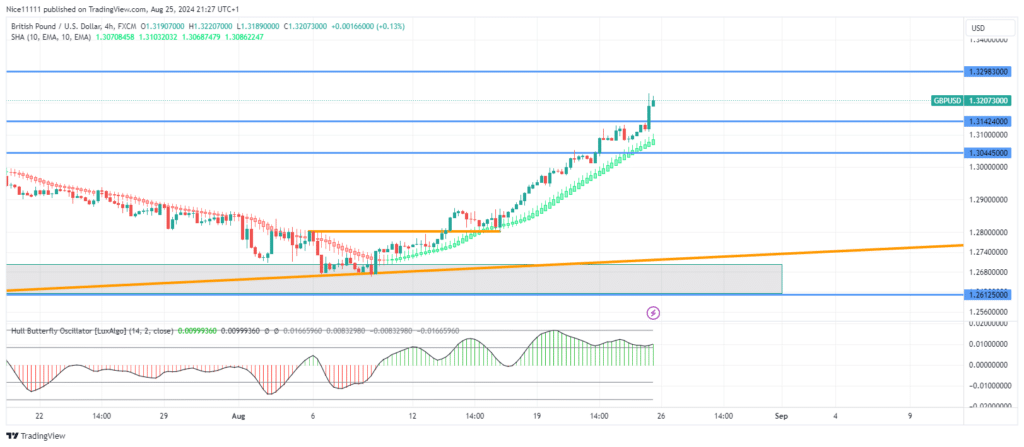
The alignment of consecutive bullish daily candles has offered limited pullback opportunities for entry. However, lower timeframes reveal chances for traders to capitalize on pullbacks with relatively tighter stop losses, targeting long positions. The 4-hour chart displays a well-defined bullish structure with clean price action, indicating further upside potential.
For those seeking reliable forex signals, monitoring the 4-hour chart could provide strategic entry points in this bullish trend.
Note: Learn2.trade is not a financial advisor. Do your research before investing your funds in any financial asset, product, or event. We are not responsible for your investment results.
Trade on MT4 with Leverage up to 1:500! Trade on MT4 with Leverage up to 1:500!
X
We use cookies to ensure that we give you the best experience on our website. If you continue to use this site we will assume that you are happy with it.