
Lucky Block Price Forecast – Expert Analysis & Trading Tips | Learn 2 Trade – Expert Analysis & Trading Tips | Learn 2 Trade – August 26th
The Lucky Block price forecast reveals that the crypto market is currently witnessing a surge in buyer activity, with Lucky Block successfully breaking through the $0.000019500 resistance level.
LBLOCKUSD Long-Term Trend: Bullish (1-Day Chart)
Key Levels
Support Levels: $0.00001360, $0.00001430
Resistance Levels: $0.00002540, $0.00002150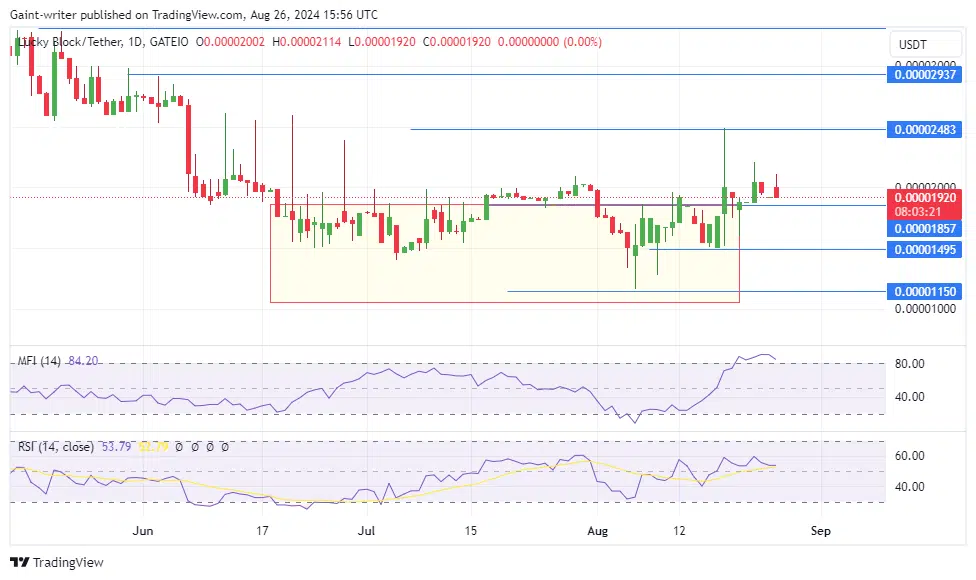
Lucky Block Price Forecast – Expert Analysis & Trading Tips | Learn 2 Trade – Expert Analysis & Trading Tips | Learn 2 Trade: LBLOCKUSD Outlook
Earlier this month,buyers established their dominance despite persistent selling pressure. The $0.00001950 level had acted as a formidable barrier for some time, with buyers attempting to overcome this market area for the past three months.
This strong resistance resulted in a period of consolidation, but buyers remained confident of a breakthrough. Earlier this week, they made a strong comeback, breaching the $0.00001950 level, although it was followed by a sharp pullback.
However, the bulls have successfully made a breach at this key level, and they are confident in shifting the market direction. Although the reversal may take some time, various indicators suggest that buyers are gaining ground. This includes the MACD (Moving Average Convergence and Divergence) indicator and the Momentum indicator, both signaling continued strength.
Lucky Block Medium-Term Trend: Bullish (4-Hour Chart)
In the short term, buyers are growing stronger, with the bulls making significant strides to build robust bullish momentum. Following the recent breakout, it is crucial for the bulls to maintain their position.
How To Buy Lucky Block
Note: Learn2.trade is not a financial advisor. Do your research before investing your funds in any financial asset, product, or event. We are not responsible for your investment results.


