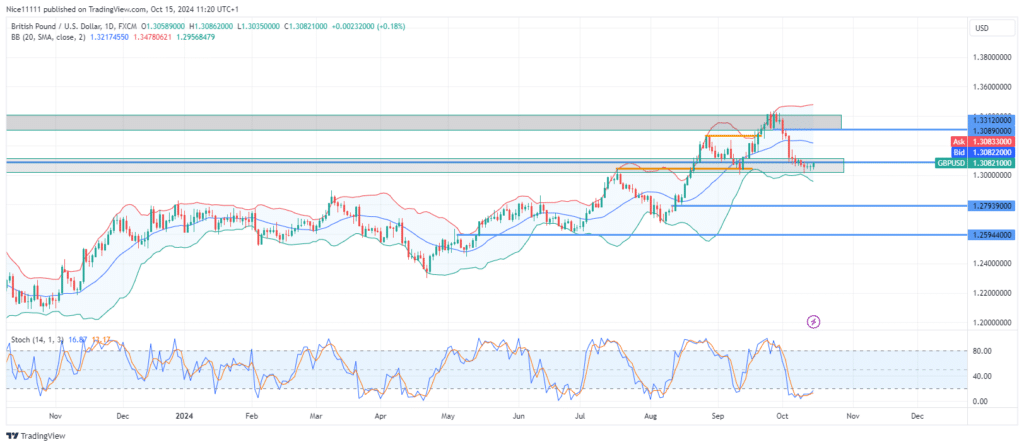
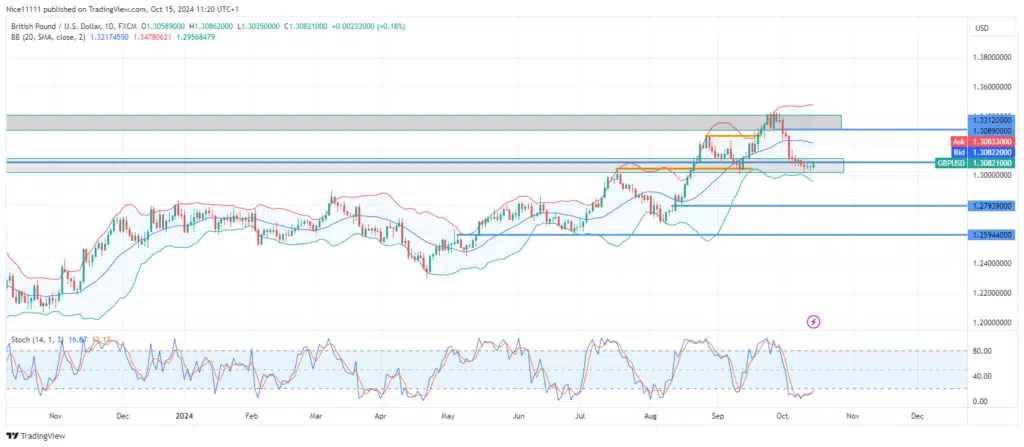
GBPUSD price has reversed sharply after reaching the 1.33120 level, forming a swing high that initiated a steady price decline. This downward movement from the swing high has been consistent, with each daily candle closing lower than its opening price. The demand zone now offers the bulls a crucial opportunity to regain control before a potential downtrend develops.
Since May, GBPUSD price has maintained a bullish market structure, consistently forming higher highs and higher lows. The recent pullback to the broken resistance at 1.30890 triggered a renewed ascent, reaching 1.33120.
On the weekly timeframe, a volume imbalance at 1.33120 halted the upward movement, an effect less noticeable on the daily chart. Additionally, the Stochastic indicator showed overbought conditions, prompting a reversal down to 1.30890. This downward movement was characterized by bearish candles and fair value gaps between the two zones, emphasizing the volatility of this price decline.
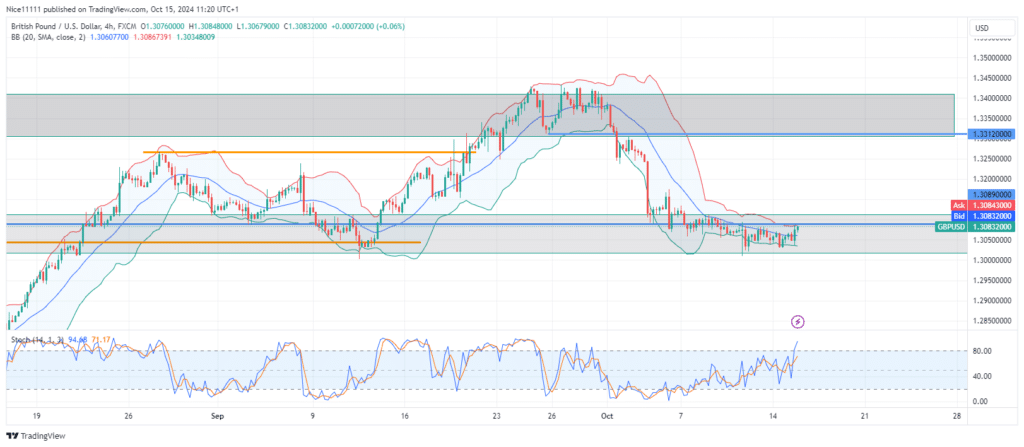
GBPUSD Short-term Trend: Bearish
The 4-hour chart indicates a slowdown in bearish momentum near the demand zone, leading to a period of sideways trading. This consolidation suggests a potential reversal. However, a break below this demand zone could signal the start of a new bearish trend. Traders might look for forex signals around these key levels to anticipate further market direction.
Note: Learn2.trade is not a financial advisor. Do your research before investing your funds in any financial asset, product, or event. We are not responsible for your investment results.
Trade on MT4 with Leverage up to 1:500! Trade on MT4 with Leverage up to 1:500!
X
We use cookies to ensure that we give you the best experience on our website. If you continue to use this site we will assume that you are happy with it.